Monitor Wildix PBX using Zabbix
- Ksenia Babych
- Tatiana Bieliakova
- Elena Kornilova
The Guide explains how to set up and use Zabbix for monitoring Wildix PBX.
Updated: May 2023
Permalink: https://wildix.atlassian.net/wiki/x/mRDOAQ
Zabbix should be installed and running on a separate server.
Step 1. Setup of zabbix-agent
1. Access PBX via SSH as root:
Go to WMS and select Terminal from the top secondary menu
Note: Terminal is available only for admin users.
Access PBX via SSH as a root
su
wildix (Password line)
!1
2. Create a file:
Use the command:
nano-tiny /etc/zabbix/zabbix_agentd.d/my.conf
Enter two lines:
StartAgents=3
Server=192.168.0.1
where 192.168.0.1 is the IP address of your server
3. Restart zabbix-agent:
Use the command:
On systems with WMS 6 version:
systemctl restart zabbix-agent.service
On systems with WMS 5 version:
/etc/init.d/zabbix-agent restart
Step 2. Setup of zabbix-server
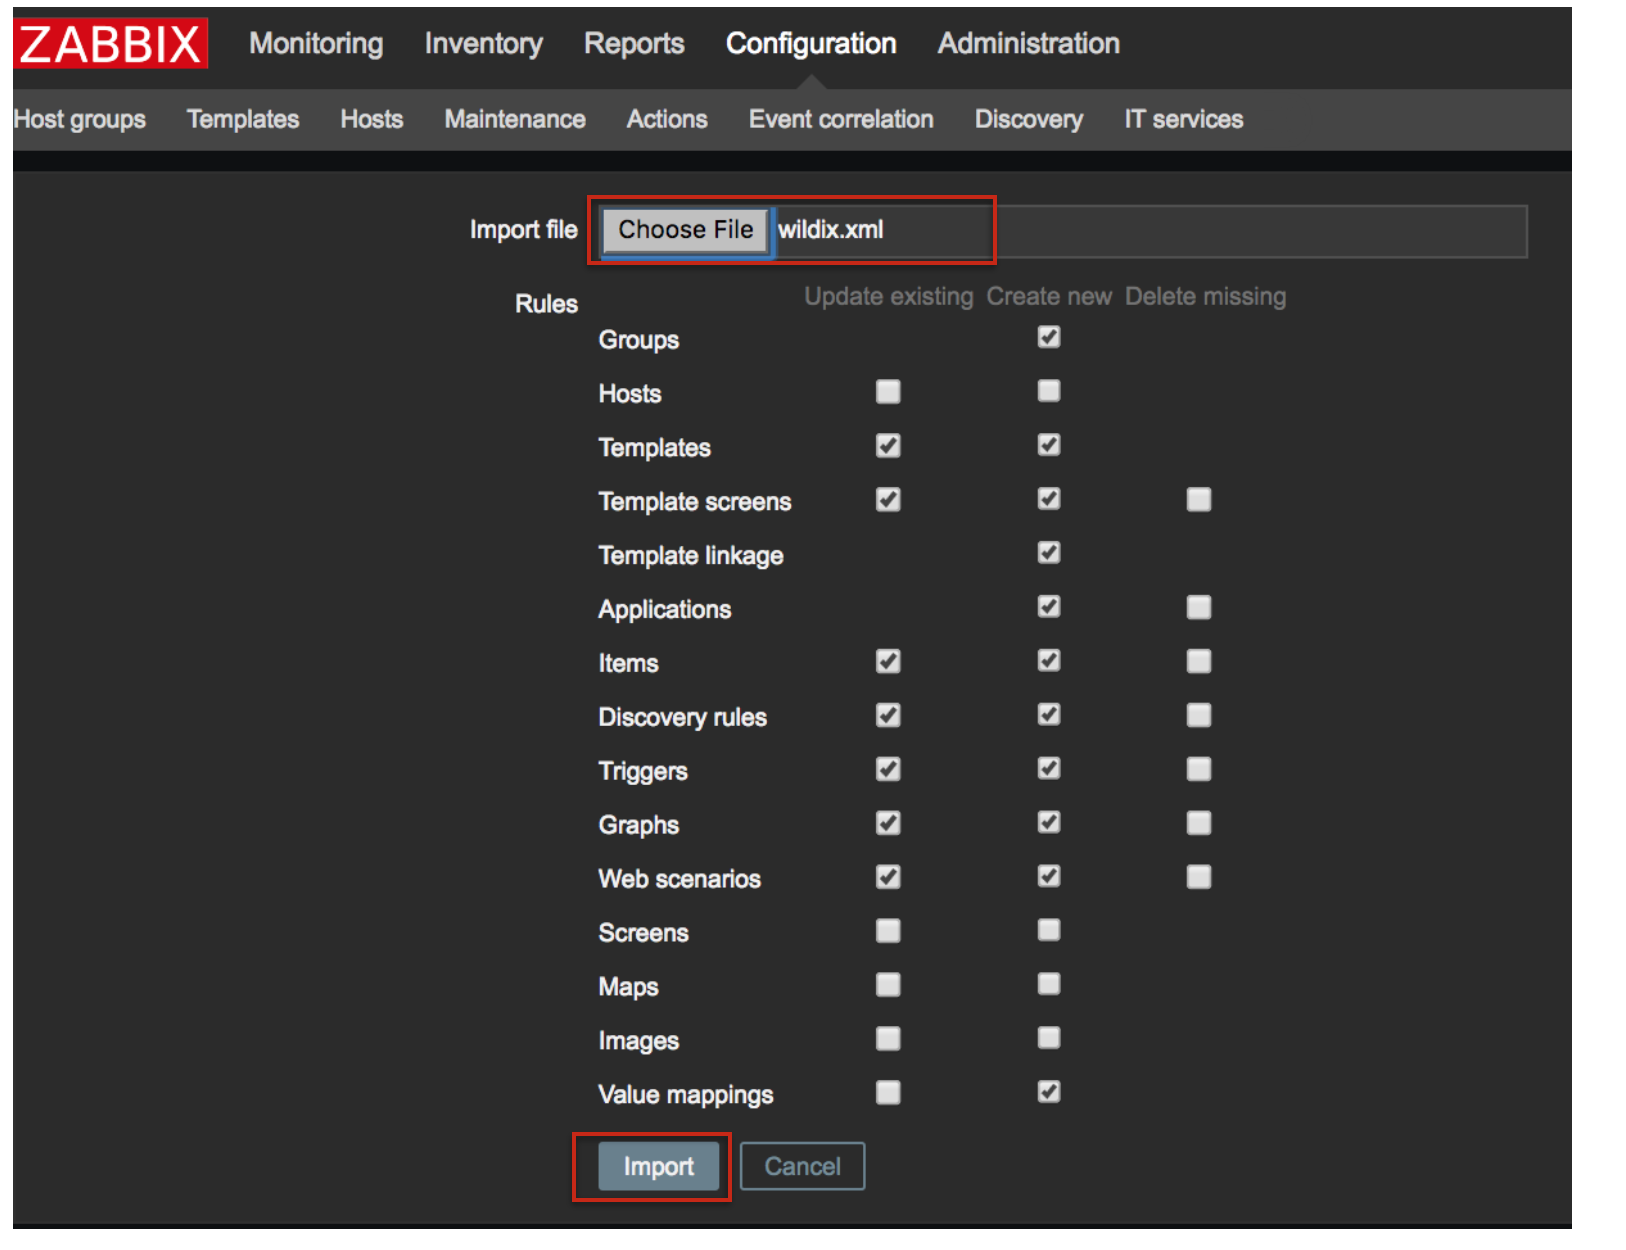
Download the template file from https://files.wildix.com/images/zabbix-templates/wildix.xml
- Access Zabbix -> Configuration -> Templates
Click Choose File to upload the template file that you have saved on your PC, then click Import
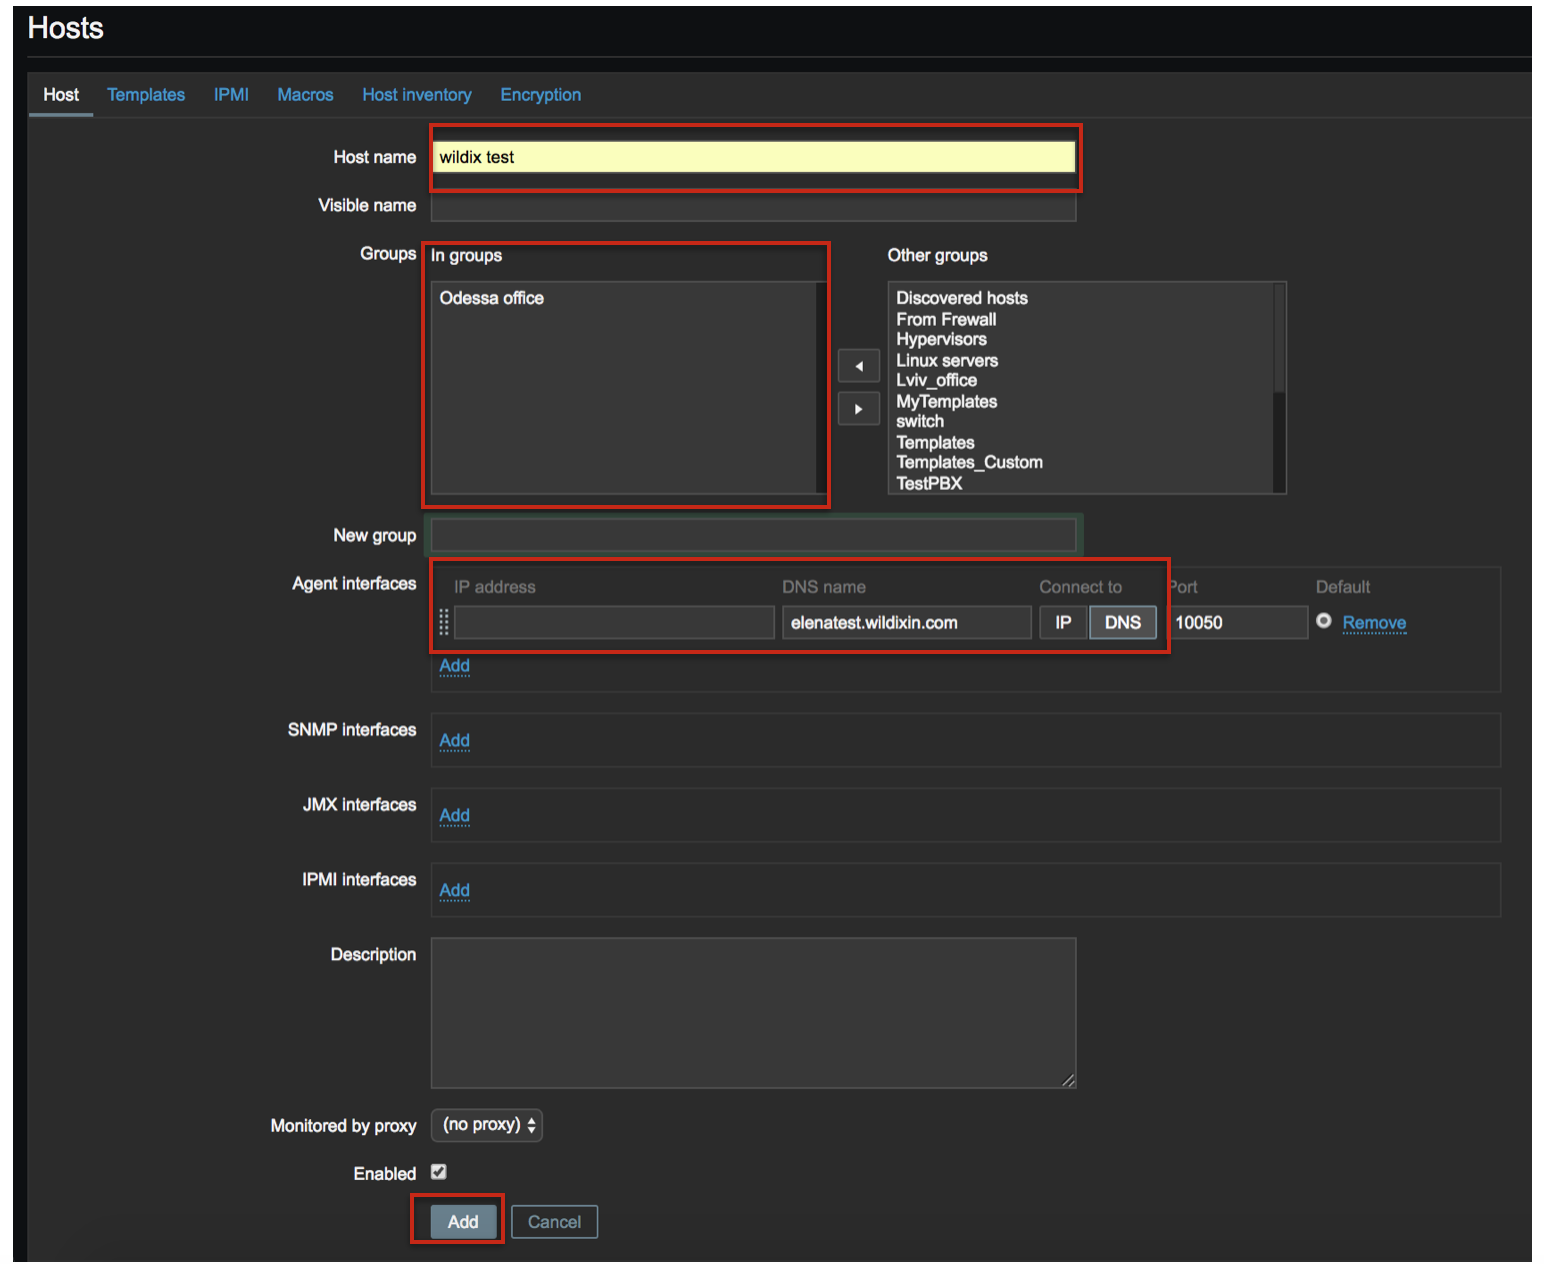
- Go to Configuration -> Hosts
- Click Create host and fill in:
- Host name
- Groups: select group(s) from “Other groups” section and move the selected group(s) to “In groups” section
- Agent interfaces: enter IP address or DNS name of your Wildix PBX (depending on what you selected, choose Connect to IP or DNS
Click Add
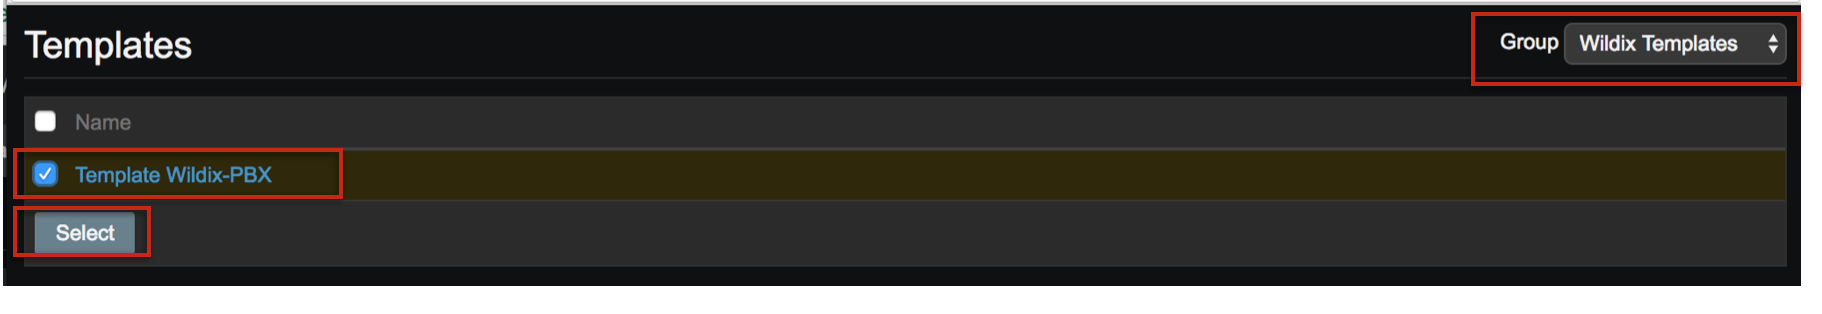
- Go to Configuration -> Templates,
- Click Group and select “Wildix Templates” from the list
Tick off “Template Wildix-PBX” and click Select
- Go to Configuration -> Hosts and find your Host on the list by its Host name
Status: “Enabled” (green)
ZBX: green (it might take some time for ZBX icon to turn green)

Ports used by Zabbix
- 8099 TCP for IP 52.18.154.170
- 10050 TCP for local Zabbix
To check it, use the command:
/etc/zabbix/zabbix_agentd.conf
Monitoring tools
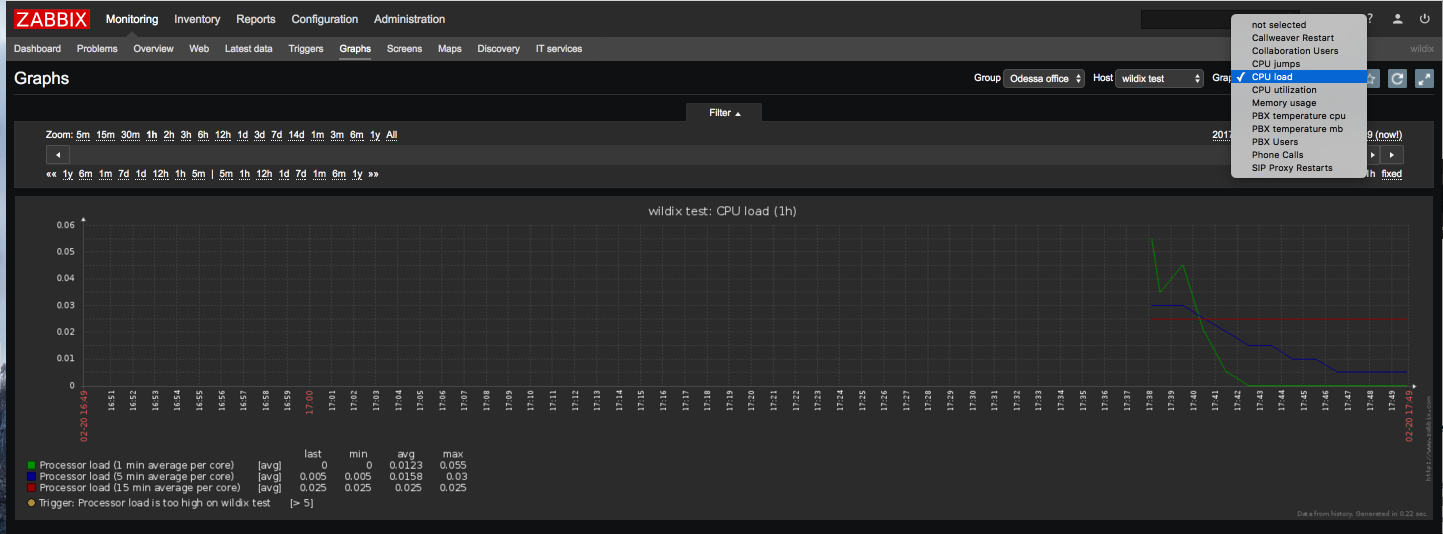
- Go to Monitoring -> Graphs
- Select your Host in the upper right section
- Select the Graph from the list of available graphs:
- Callweaver Restart
- Collaboration Users
- CPU jumps
- CPU load
- CPU utilization
- Disc space usage*
- Memory usage
- Network traffic*
- PBX temperature cpu
- PBX temperature mb
- PBX users
- Phone calls
- SIP Proxy Restarts
*these sensors become available after some time (it is necessary to update the web page)
Monitoring problems
- Go to Monitoring -> Problems. Here you can see what issues you currently have with PBX. Issues are those triggers that are in the “Problem” column. When a trigger is detected, a new problem notification appears in the list. Refer to this chapter to see what each column means
- Find your Host in the list of all current problems. You can use Filter to find it:

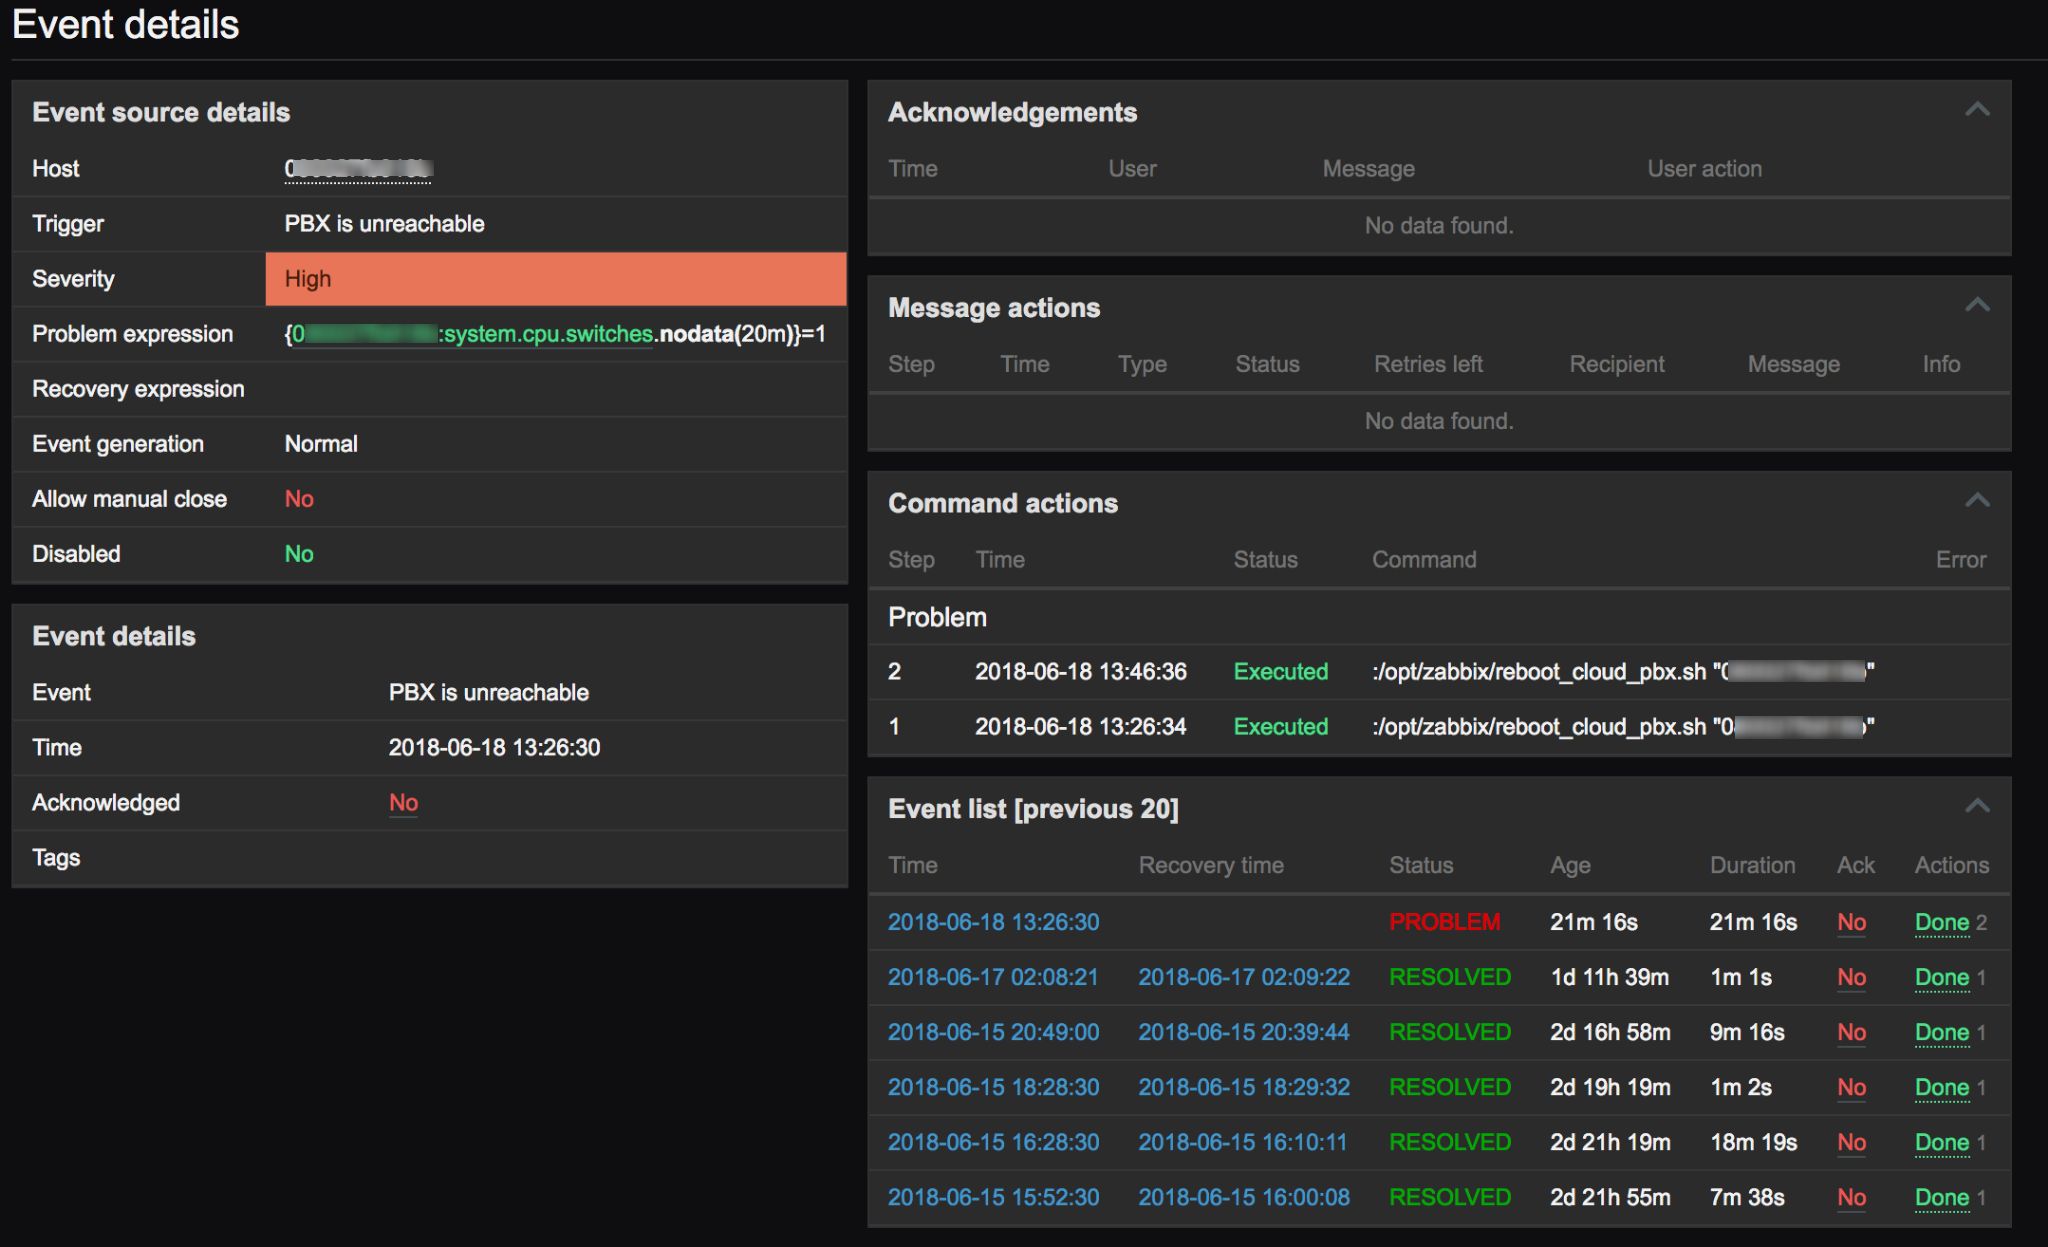
Click on the Time to open problem details:

- Details about the problem (Event details), its source, acknowledgements, actions taken (messages, remote commands) and previous similar problems are displayed:
Note: You can also look over the current problems in Monitoring -> Dashboard -> Last 20 issues: only last 20 problems are displayed here.
Columns' description
| Column | Description |
|---|---|
| Time | Problem start time is displayed. |
| Severity | Problem severity is displayed. Problem severity is based on the severity of the underlying problem trigger. |
| Recovery time | Problem resolution time is displayed |
| Status | Problem status is displayed: |
| Info | An green information icon is displayed if a problem is closed by global correlation or manually by acknowledgement. Rolling a mouse over the icon will display more details: |
| Host | Problem host is displayed. |
| Problem | Problem name is displayed. Problem name is based on the name of the underlying problem trigger. |
| Duration | Problem duration is displayed. |
| Ack | The acknowledgement status of the problem is displayed: Yes - green text indicating that the problem is acknowledged. A problem is considered to be acknowledged if all events for it are acknowledged. No - a red link indicating unacknowledged events. If you click on the link you will be taken to a bulk acknowledgement screen where all problems for this trigger can be acknowledged at once. This column is displayed if problem acknowledgement is activated in Administration -> General. |
| Actions | Action status is displayed: In progress - action is being taken Done - action is completed Failures - action has failed The number of actions taken on the problem (such as notifications sent or executed remote commands) is also displayed. |
| Tags | Event tags are displayed (if any). |