Cloud Analytics (CDR-View 2.0) in Collaboration
On this page, you can find detailed description of the Cloud Analytics (CDR-View 2.0) feature in Collaboration which provides all the information you need to keep on top of your business.
Created: July 2023
Updated: July 2024
Permalink: https://wildix.atlassian.net/wiki/x/AYBJDQ
Introduction
Same as CDR-View, Analytics tab in Collaboration allows to monitor the call activity of the employees and get reports related to the number of calls, costs, call duration, usage of trunks, etc, as well as analyze the activity of call agents and response groups.
Requirements
WMS 6.03.20230630.3 or higher on a standalone PBX or a whole WMS Network
License: UC-Premium
- ACL rules set in WMS:
- can use Analytics: adds display of the Analytics button in Collaboration
- can See analytics: lets to choose which groups data will be available in Analytics reports
Note:
- Analytics data is stored in the AWS datacenter in the region where the PBX is located.
- Analytics is not available if Collaboration is opened via iframe.
- Analytics is not available if there is any licensing issue on the PBX. To enable Cloud analytics, there should be a valid license set, complying with the rule: 1 Customer = 1 set of licenses = 1 WMS Network.
Events sending / data gathering should be enabled in WMS -> PBX -> Features -> Cloud Analytics. Starting from WMS v. 6.06.20240530.1, it is activated by default on all types of PBXs.
Note:
- If sending of the events was enabled and then disabled, the old data is still stored in the data base. For the old data be removed, a ticket to customer care has to be opened.
- On WMS versions prior to v. 6.06.20240530.1, Cloud Analytics is enabled by default if a PBX or whole WMS Network are running in the Cloud. In case of a standalone Virtual/ Hardware PBX, or if there is a mix of Cloud and Virtual/ Hardware PBXs in a WMS Network, Cloud Analytics should be enabled manually by admin.
Documentation: WMS Settings Menu - Admin Guide (Features section).
How to access Analytics
To access Analytics, click on the Analytics button at the top of the screen:

View Different Charts
Collaboration Analytics provides the report data in different charts and you can easily navigate between them by choosing the necessary tab:

The following views are available:
- Home: the tab displays call distribution by countries, by status and direction:

Simple Grid: includes such data as date, number/ extension, name, direction, status, talk time, etc.

Note:
- Part refers to the number of transfers, starting from 0. First part of a call is a 0 transfer, the next on is the first transfer (Part=1), etc.
- Ring Time displays the time when an agent is being called. In case of a call group, if at least 1 available agent is called, it is considered ring time. If there are no available members in the call group, it is considered wait time. Wait Time consists of time spent in IVR, listening to announcements, in queue while no agents are available, and time when the call was put on hold.
In the column with the sound icon, you can download call recordings:

Current limitations:
- In case of a WMS Network, you need to be logged in to the PBX, which the recording belongs to. Otherwise, the recording cannot be downloaded.
- If there were several recordings during a call, only the latest recording is displayed.
- Agents: displays data grouped by agents including talk time and ring time, as well as the number of completed and missed calls:

- Agents Extended: displays extended data grouped by agents including talk time and ring time, number of completed and missed calls, split by inbound and outbound calls:

- Companies: displayed data grouped by companies, including the number of missed and completed calls, ring and talk time:

Further tabs present call data in various charts:- Line Chart:

- Area Chart:

- Pie Chart:

- Bar Chart:

- Column Chart:

- Timeline Column Chart:

- Line Chart:
- Advanced Grid: provides extended information compared to Simple Grid including Cost, Service number, PBX information, flags, trunk, tags, service, etc.

Note:
- Flow id is the unique identifier of a call, including all call transfers.
For example, you see a call that consists of multiple parts and want to filter all its parts. You can use Flow id for this. - The columns From MOS / To MOS (the Mean Opinion Score) display the caller / callee overall voice call quality. MOS is a rating from 1 to 5 ( 1 = the lowest score, 5 = the highest score), which is standardized by the International Telecommunications Union ITU-T. Note: Currently, MOS may not be counted for some calls, which should be improved in future releases.
- Service Number column displays a) for an incoming call: the phone number of the trunk a customer called to b) for an outcoming call: the phone number of the trunk via which the outcoming call was made and which is displayed to a customer. For internal calls, the value is Null. Service Number column is available starting from WMS 6.04.
- In the Flags column, call flow is marked with flags (which act like tags). Currently, the following flags are available: voicemail, wizyConference, pbxConference, mobility, fax.
- Starting from WMS v. 6.06.20240425.1, there is the column Cost, which displays cost for external calls
Filter Report Data
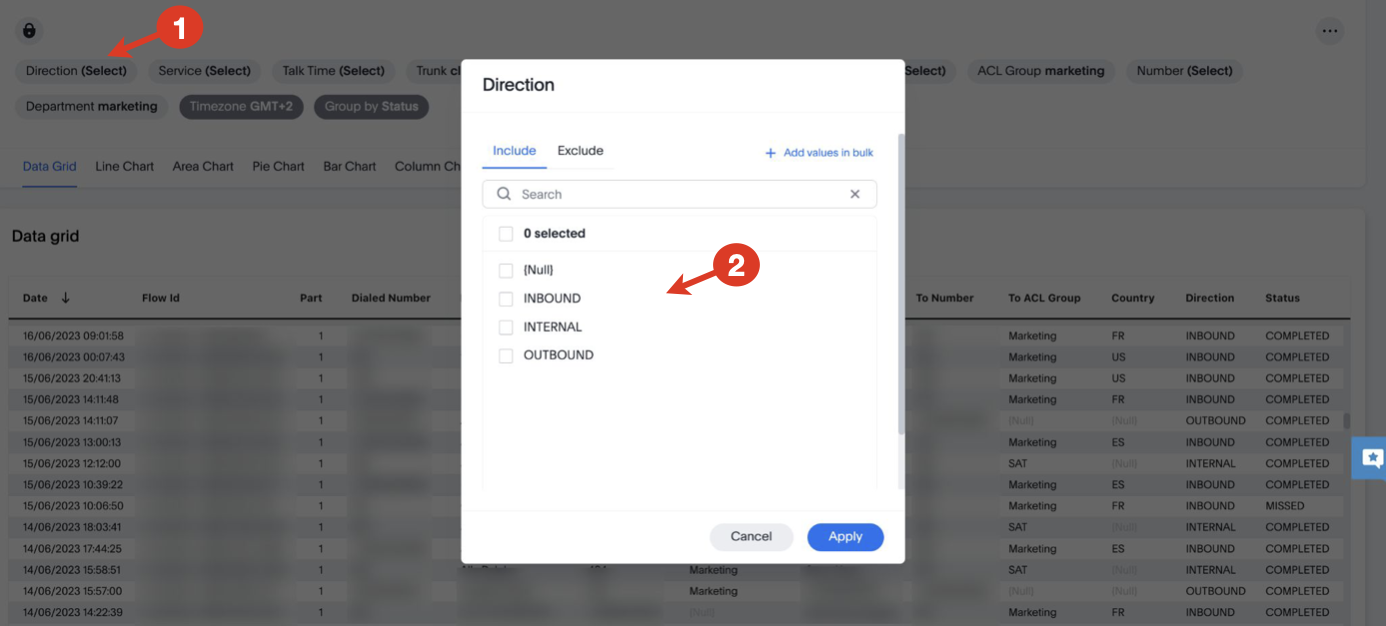
On the page that opens, you can see a report that displays data according to the filters at the top:

When you click on a filter, a pop-up window appears, which allows you to choose by which parameters you want to filter the report. E.g. clicking on the filter Direction (1), you can select inbound/ internal/ outbound calls (2):
Note:
- Currently, the selected filters are cleared after the page is reloaded. However, you can save filter settings for future use (see more in the section Save filter settings below).
- It is currently not possible to change the metric. The metric is always the number of calls.
Only 1000 rows are displayed by default. After scrolling down to the 1000th row, the table loads the next 1000, and so on, until all the filtered data is loaded. However, when you export the filtered data in CSV, the report includes all rows of the filtered data (not only the first 1000).
The filters include:
- Direction: choose if you want to see inbound, internal, or outbound calls
- Service: select the services (Call groups) you want to be displayed
- Talk Time: select talk time (currently, the filter is available in seconds)
- Trunk: choose the trunks to be included in the report
- Tags: select available tags
- PBX: choose the necessary PBX serial(s)
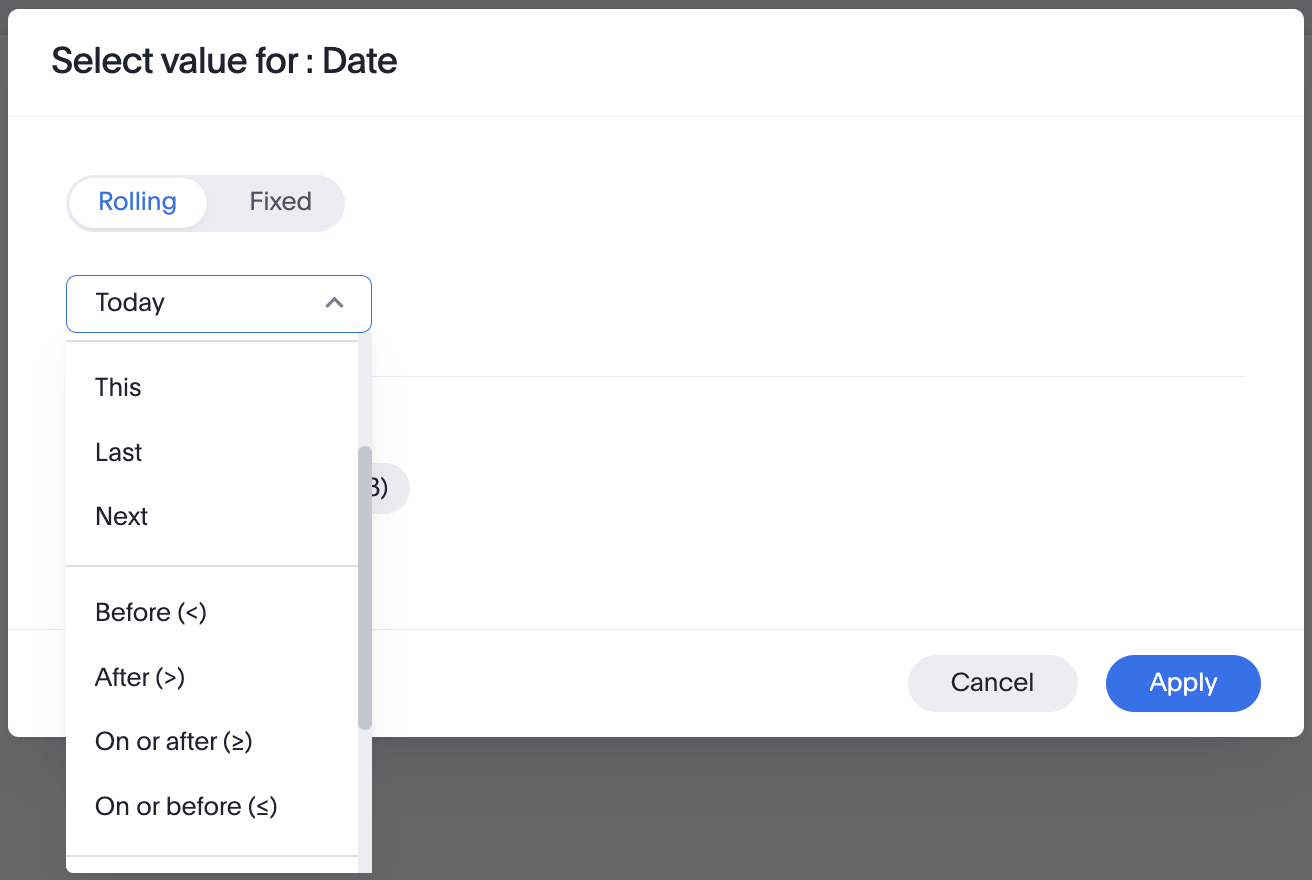
- Date: choose the period by which the data should be filtered:
- Tab Rolling:
- Yesterday
- Today
- This (minute(s), hour(s), day(s), week(s), month(s), quarter(s))
- Last (number of minute(s), hour(s), day(s), week(s), month(s), quarter(s))
- Before (<)
- After (>)
- On or after (≥)
- On or before (≤)
- Week to date
- Month to date
- Quarter to date
- Tab Fixed:
- Between / Not in between
- On (=) / Not on (!=)
- In month and year
- In quarter and year, etc.
- Tab Rolling:
- Name: select the user(s) to be included in the report
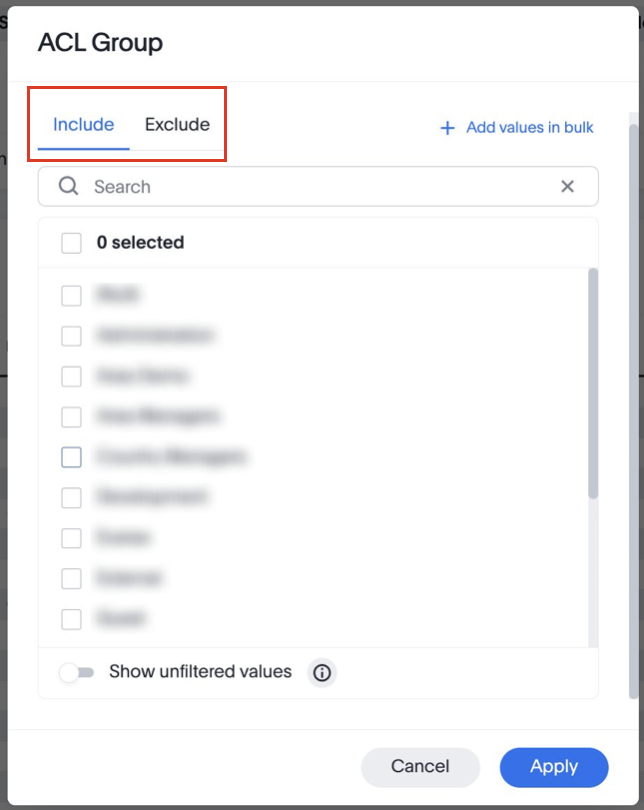
- ACL Group: select ACL group(s) to be displayed
- Number: choose the number/ extension to filter all incoming and outgoing calls to the selected number/ extension
- Department: select the necessary department(s) of PBX users
- Timezone: choose the timezone
- Group by: choose if you want to group the data by Status, Direction, Service, Trunk, or PBX.
For most filters, you can choose either to include or exclude data:
Save filter settings
Add a new view
After you've applied filters to the report, you can save the filter settings:
- Click on the button Save view to the left of the filter panel at the top:

- Enter the name of the report with the set of filters you've applied and click Save:
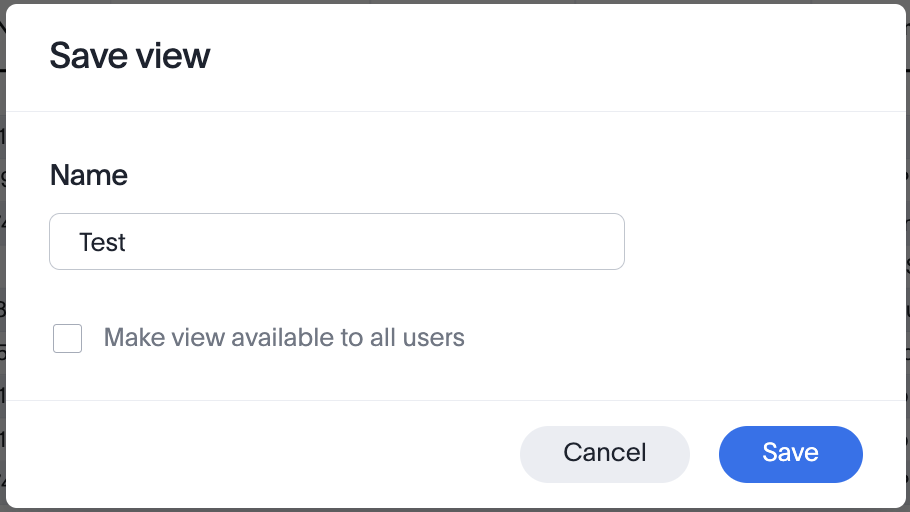
Note: The option "Make view available to all users" is greyed out and not available.
Change view
The next time you open Analytics, the system automatically opens the report in the saved view. To return to the default view, click on the name of the current view at the top:

You can switch another view or Revert Liveboard:

Manage views
Click on the button to the left of the filters section on the top and select Manage views:

On the Manage views screen, you can rename the view or delete it:
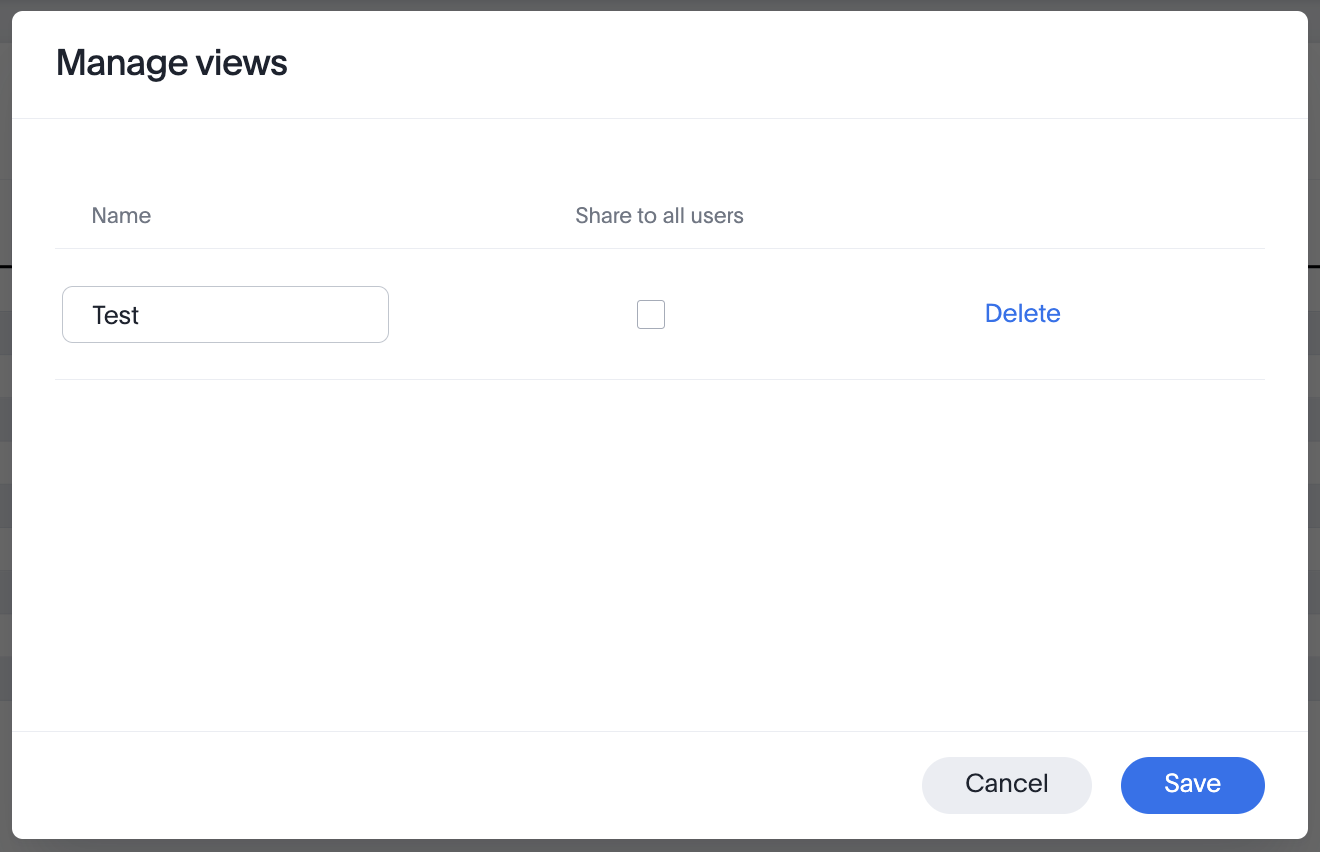
Note: The option "Share to all users" is greyed out and not available.
Filter data via values in the report
Starting from WMS 6.04, it is possible to filter report data by choosing necessary values right on the report:
- Select the item you want to filter data by (e.g. Internal calls as on the screenshot below)
- Right-click on it and press Filter:

The report is then filtered by the parameter you have just chosen:

You can select multiple filters if required (select the item on the report -> right-click on it and press Filter again).
To clear the filters, click Clear all at the top:
![]()
Choose time bucket / filters / sorting via the charts
You can also choose time bucket, apply filters or apply preferable sorting directly on the charts. For this, click on the top bottom button (1) ( in our example on the screenshot below it is "Daily Date"), and select the option you need (2):

Schedule Reports
Create scheduled report
Collaboration Analytics allows to configure scheduled reports to have them sent to email(s) at specified interval.
To schedule a report, click on the More (three dots) button (1) -> choose Schedule option (2):

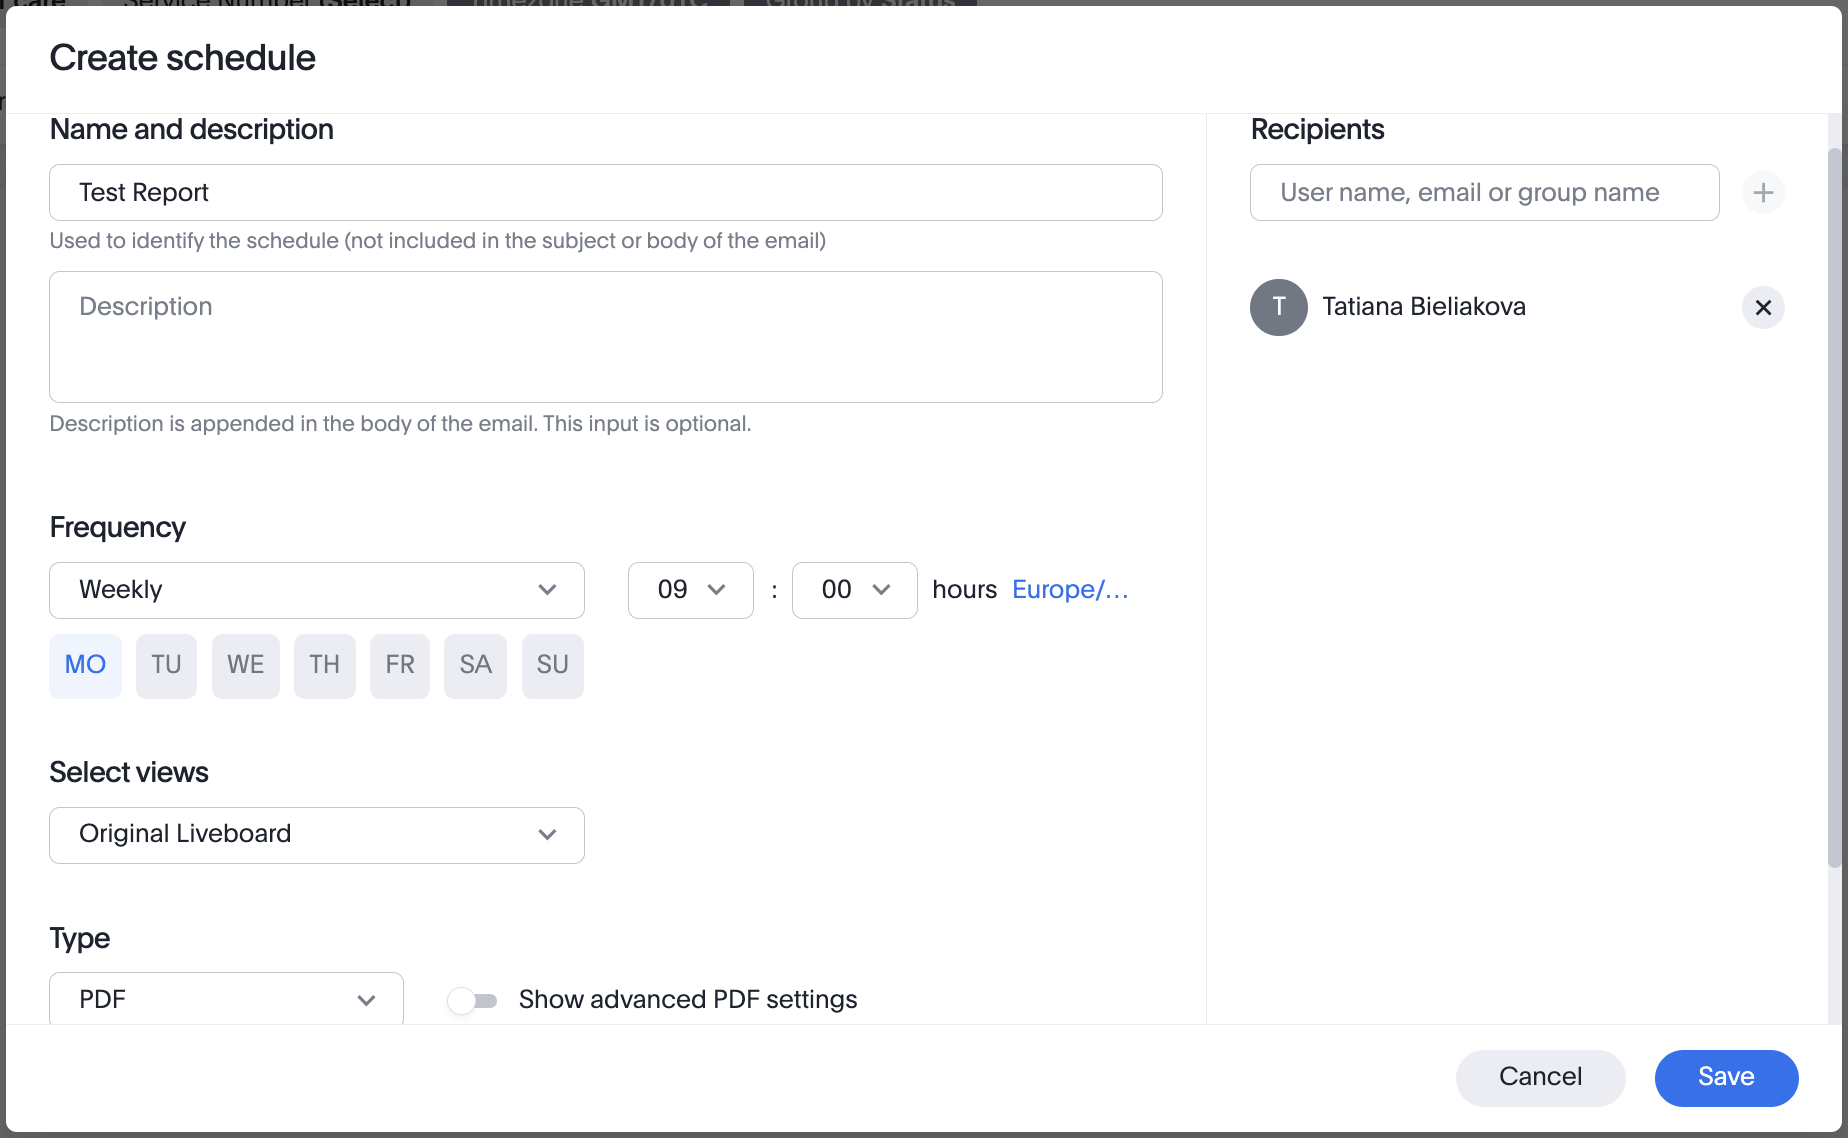
On the Create Schedule screen that opens, fill out the following fields:
- Name: enter title for your scheduled report
- Description (optional): provide description if required; the description is included in the body of the email
- Frequency:
- choose the preferred option: Every N minutes / Hourly / Daily / Weekly / Monthly
- select at which time the report should be sent
- choose day for sending the scheduled report
- Select views: select which reports you would like to receive. In case you have saved views (reports with applied filters), they are available here.
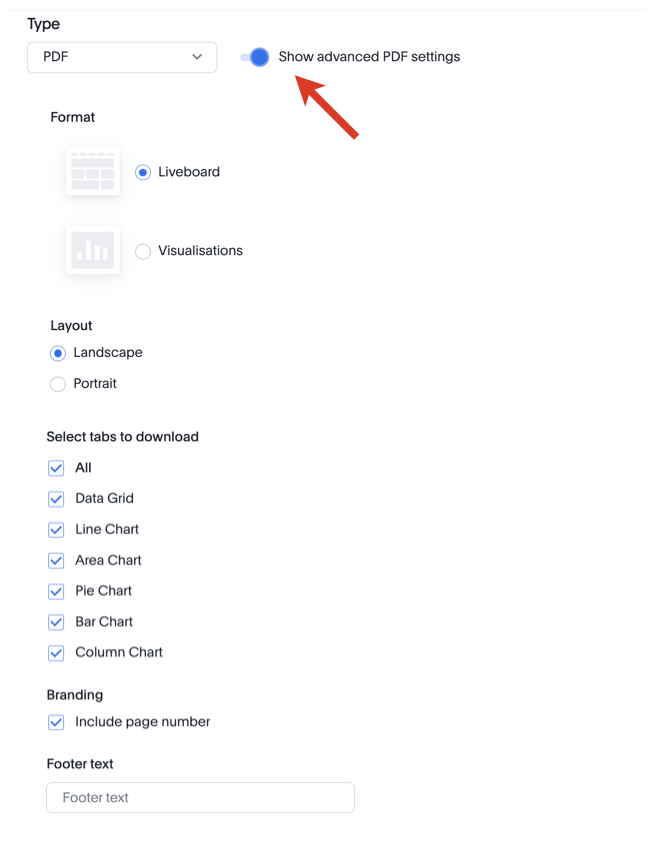
Type: choose if you want to receive the report in PDF or CSV
Note:
- CSV files are sent only for the visualisations that have tables. Scheduled reports in PDF format are mostly aimed at charts and graphs, while tables may not contain full information. To get complete data in tables (e.g. the list of calls), we recommend using CSV format.
- In CSV files, the fields that start with “+” are automatically added a single quotation mark (‘) at the beginning of the field.
- For PDF, you can turn the toggle on next to Show advanced PDF settings and configure the following options:
- Format: Liveboard or Visualisations
- Layout: Landscape or Portrait
- Select tabs to download: choose if you want to receive all or specific charts only
- Branding: decide if page number should be included
- Footer text: enter text for the footer of the report
Recipients: you are automatically added as recipient of the report. You can also add other users or groups to send the report to
Note:
- Users may not appear in the Recipients drop-down list unless they open Cloud Analytics at least once. E.g. if the colleague you want the scheduled report to be sent to, hasn't accessed Analytics at least one time, you won't be able to choose them as a recipient.
- Under the Groups section in the Recipients drop-down list you can find names of Customers on the Portal. In case you select a group, all users on the PBX (or WMS Network) that belongs to the customer, will receive the scheduled report via email (in case they accessed Analytics at least once).
Click Save to save the scheduled report.
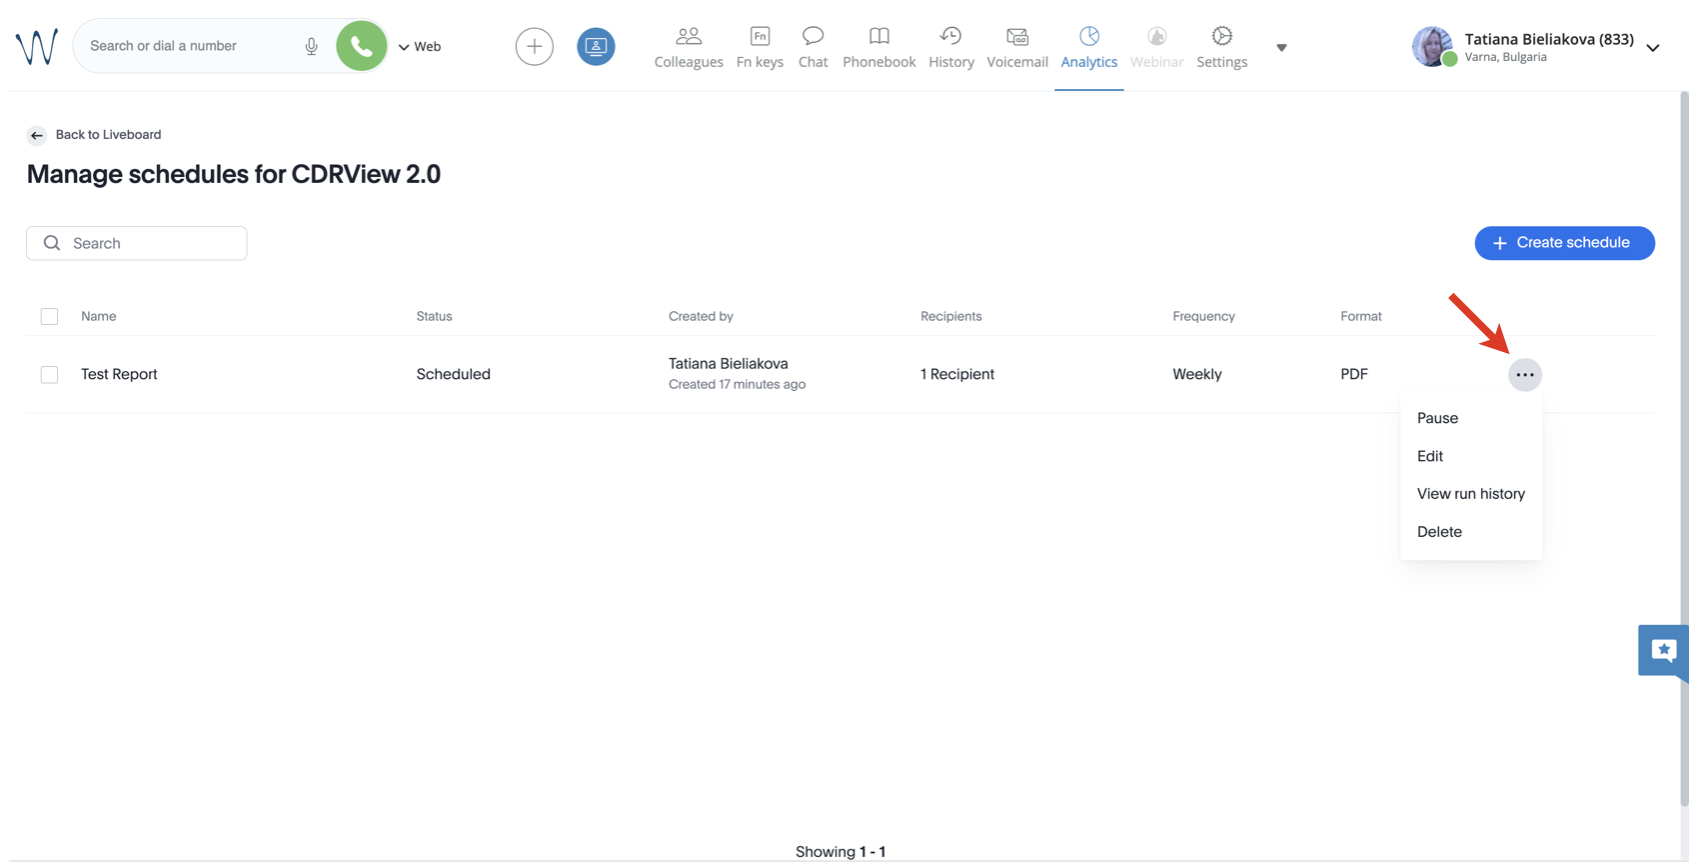
Manage scheduled reports
To manage your scheduled reports, click the More (three dots) button (1) and select Manage schedules (2):

Click More (three dots) next to the necessary report, where you get the following options:
- Pause
- Edit
- View run history
- Delete
In case of pausing a scheduled report, its status changes to Paused:
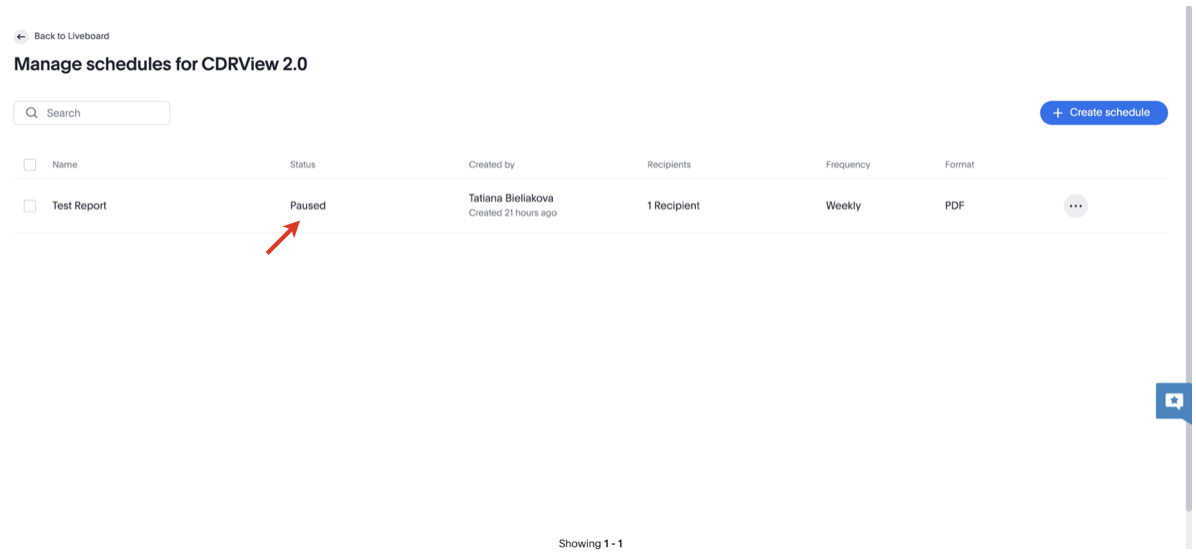 You can resume the scheduled report any time.