Meeting Analytics in x-bees
On this page, you can find detailed description of MeetingView Liveboard in x-bees, available reports and filters.
Created: April 2024
Updated: May 2024
Permalink: https://wildix.atlassian.net/wiki/x/AYBUHQ
Introduction
MeetingView in x-bees allows you to monitor conference activity of employees and get reports which include such data as the number of conferences, date and time, conference title, duration, number of participants and participants list etc.
Requirements
- WMS version 6.01.20220621.2 or higher on a standalone PBX or a whole WMS Network
- License: x-bees-SuperBee
Note:
- Analytics data is stored in an AWS datacenter in the region where the PBX is located.
- Events sending / data gathering should be enabled in WMS -> PBX -> Features -> Cloud Analytics. It is automatically activated if a PBX or whole WMS Network are running in the Cloud. In case of a standalone Virtual/ Hardware PBX, or if there is a mix of Cloud and Virtual/ Hardware PBXs in a WMS Network, Cloud Analytics should be enabled manually by admin. Documentation: WMS Settings Menu - Admin Guide (Features section).
Note: If sending of the events was enabled and then disabled, the old data is still stored in the data base. For the old data be removed, a ticket to customer care has to be opened.
Important: If you need to disable Cloud Analytics, please contact Wildix Technical Support, as it may affect presence sync in x-bees.
How to access MeetingView
To access MeetingView Liveboard:
- Go to Analytics -> on the Liveboards tab, select MeetingView:

View Different Charts
x-bees MeetingView Liveboard provides the report data in different charts and you can easily navigate between them by choosing the necessary one:
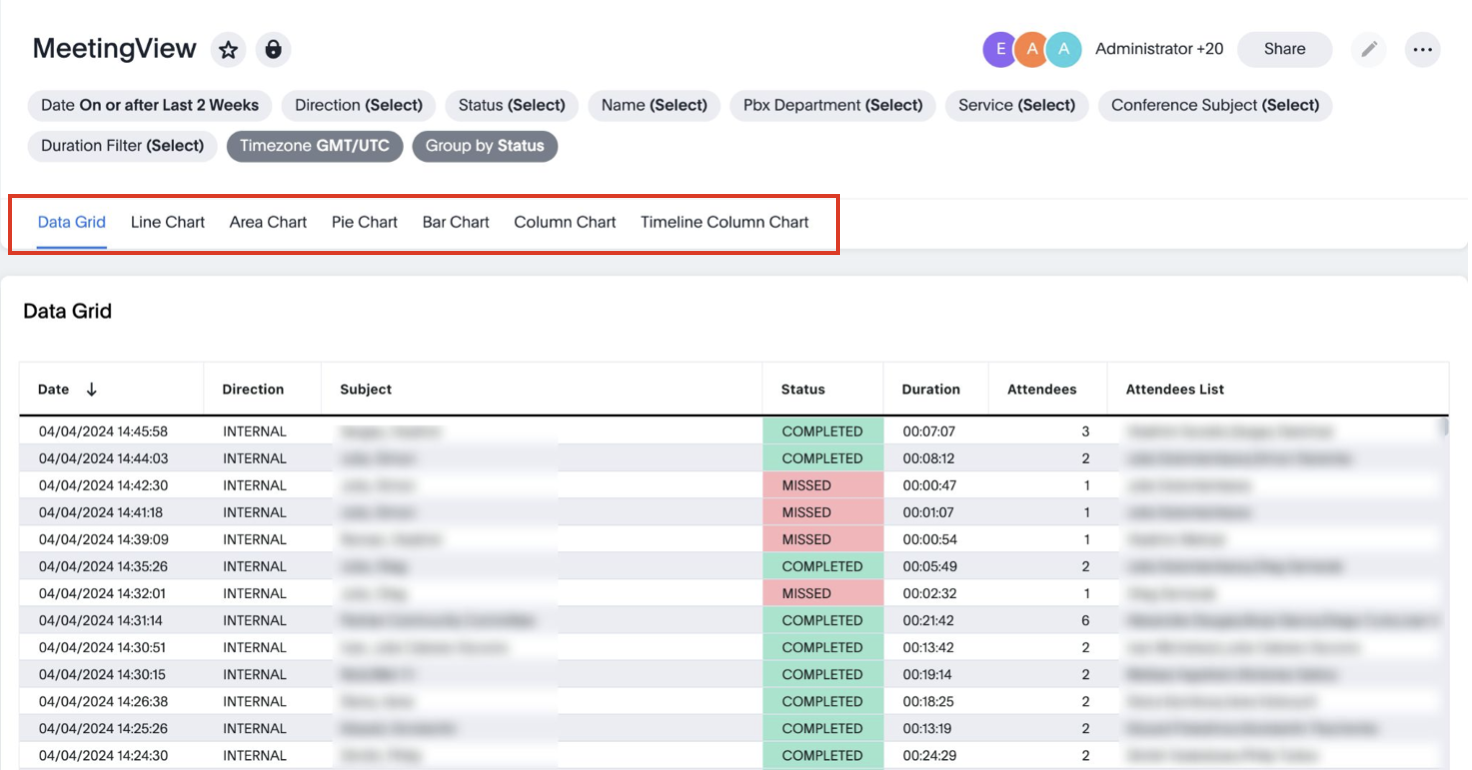
The following views are available:
Data Grid: includes the list of conferences, their date and time, direction (internal, outbound, internal), conference subject, status (completed, missed), duration, number of attendees and attendees list.

- Line Chart:

You can change the time bucket by clicking "Daily date" at the bottom of the chart to get a weekly, monthly, quarterly, or annual report. To switch between Unique or Total session ID count display by clicking Unique Count Session ID -> Aggregate at the left of the report. - Area Chart:

You can change the time bucket by clicking "Daily date" at the bottom of the chart to get a weekly, monthly, quarterly, or annual report. To switch between Unique or Total session ID count display by clicking Unique Count Session ID -> Aggregate at the left of the report.
- Pie Chart

- Bar Chart

- Column Chart

- Timeline Column Chart

Filter Report Data
On the page that opens, you can see a report that displays data according to the filters at the top:

When you click on a filter, a pop-up window appears, which allows you to choose by which parameters you want to filter the report. E.g. clicking on the filter Direction (1), you can select inbound/ internal/ outbound conferences (2):
Notes:
- Currently, the selected filters are cleared after the page is reloaded. However, you can save filter settings for future use (see more in the section Save filter settings below).
- Only 1000 rows are displayed by default. After scrolling down to the 1000th row, the table loads the next 1000, and so on, until all the filtered data is loaded. However, when you export the filtered data in CSV, the report includes all rows of the filtered data (not only the first 1000).
The filters include:
- Date: choose the period by which the data should be filtered:
- Tab Rolling:
- Yesterday
- Today
- This (minute(s), hour(s), day(s), week(s), month(s), quarter(s))
- Last (number of minute(s), hour(s), day(s), week(s), month(s), quarter(s))
- Before (<)
- After (>)
- On or after (≥)
- On or before (≤)
- Week to date
- Month to date
- Quarter to date
- Tab Fixed:
- Between / Not in between
- On (=) / Not on (!=)
- In month and year
- In quarter and year, etc.
- Tab Rolling:
Direction: choose if you want to see inbound, internal, or outbound conferences
Note:
- A conference is considered outbound if both criteria below are met:
- there are external users
- an agent (PBX user) started the conference.
- A conference started by external user is marked as inbound.
- A conference is considered outbound if both criteria below are met:
Status: choose if you want the report to display completed or missed conferences
Note:
- A conference is considered missed in the following cases:
- There was only one participant in the conference.
For inbound conference: in case there were no agents (even if several external users joined).
For outbound conference: if there were no external users (even if several agents attended the meeting).
- A conference is considered missed in the following cases:
Name: select the user(s) to be included in the report
- PBX Department: filter the data by choosing the preferred department
- Service: select the services you want to be displayed
- Conference Subject: filter the report by conference subject
- Duration Filter: filter data by conference duration (e.g. conferences less than 10 seconds, up to 5 minutes/ 30 minutes etc.)
- Timezone: choose the timezone
- Group by: choose if you want to group the data by Status, Direction, Service.
For most filters, you can choose either to include or exclude data: 
Save filter settings
Add a new view
After you've applied filters to the report, you can save the filter settings:
- Click on the button Save view to the left of the filters panel:

- Enter the view name and click Save:

Note: The option "Make view available to all users" is greyed out and not available for the MeetingView report.
Change view
The next time you open the liveboard, the system automatically opens the report in the saved view. To return to the default view, click on the name of the current view at the top (1) and press Reset Liveboard (2):

Here you can also switch to another saved view if available.
Manage views
Click on the button to the left of the filters section on the top (1) and select Manage views (2):

On the Manage views screen, you can rename the view or delete it:

Filter data via values in the report
Starting from WMS 6.04, it is possible to filter report data by choosing necessary values right on the report:
- Select the item you want to filter data by (e.g. completed status as on the screenshot below)
- Right-click on it and press Filter:

The report is then filtered by the parameter you have just chosen:

You can select multiple filters if required (select the item on the report -> right-click on it and press Filter again). To clear the filters, click Clear all at the top:
![]()
Schedule Reports
Create scheduled report
MeetingView allows you to configure scheduled reports to have them sent to email(s) at a specified interval.
To schedule a report, click on the More (three dots) button (1) -> choose Schedule option (2):

On the Create Schedule screen that opens, fill out the following fields:
- Name: enter title for your scheduled report
- Description (optional): provide description if required; the description is included in the body of the email
- Frequency:
- choose the preferred option: Every N minutes / Hourly / Daily / Weekly / Monthly
- select at which time the report should be sent
- choose day for sending the scheduled report
Type: choose if you want to receive the report in PDF or CSV

Note:
- CSV files are sent only for the visualisations that have tables. Scheduled reports in PDF format are mostly aimed at charts and graphs, while tables may not contain full information. To get complete data in tables (e.g. the list of conferences), we recommend using CSV format.
- For PDF, you can turn the toggle on next to Show advanced PDF settings and configure the following options:
- Format: Liveboard or Visualisations
- Layout: Landscape or Portrait
- Select tabs to download: choose if you want to receive all or specific charts only

- Recipients: you are automatically added as recipient of the report. You can also add other users or groups to send the report to
Note:
- Users may not appear in the Recipients drop-down list unless they open Analytics at least once. E.g. if the colleague you want the scheduled report to be sent to, hasn't accessed Analytics at least one time, you won't be able to choose them as a recipient.
- Under the Groups section in the Recipients drop-down list you can find names of Customers on the Portal. In case you select a group, all users on the PBX (or WMS Network) that belongs to the customer, will receive the scheduled report via email (in case they accessed Analytics at least once).
Click Save to save the scheduled report.
Manage scheduled reports
To manage your scheduled reports, click the More (three dots) button and choose Manage schedules:

Click More (three dots) next to the necessary report, where you get the following options:
- Pause
- Edit
- View run history
- Delete

In case of pausing a scheduled report, its status changes to Paused. You can resume the scheduled report any time.