x-bees Analytics
- Tatiana Bieliakova
- Ksenia Babych
- Vladimir Sorokin
On this page, you can find documentation about x-bees Analytics which provides all the information you need to keep on top of your business.
Other x-bees documentation: x-bees documentation.
Created: May 2022
Updated: December 2024
Permalink: https://wildix.atlassian.net/wiki/x/EArOAQ
Introduction
x-bees Analytics is an advanced yet easy-to-use analytics tool, which lets you monitor all the data you need to always stay on top of your business. With x-bees, you are not limited to a predefined set of data tables and charts. On the contrary, you set them up yourself choosing the data you are interested in and customizing tables and charts to your personal liking. This means x-bees Analytics tool can perfectly address whatever need you may have.
Requirements
- WMS version 6.01.20220621.2 or higher on a standalone PBX or a whole WMS Network
- License: x-bees-SuperBee
Note: Analytics is not available if x-bees is opened in Incognito window in browser or via iframe.
How to access
To access x-bees Analytics, click on the Analytics button on left-hand part of the screen: 
Here, you can find 4 tabs:
- Liveboards: a collection of answers in a pinboard (dashboards) that you use most often in your analytics purposes
- Search: allows to search for data, configure the view of charts and tables containing the search results, save them to Answers and Liveboards, etc.
- Answers: the list of saved answers (the results of your search)
- CDR-View2.1: pre-configured reports that allows to monitor the call activity of the employees and get reports related to the number of calls, costs, call duration, usage of trunks, etc.. For more details, check out the dedicated guide How to use CDR-View 2.0.

Note: Starting from WMS 6.04.20230815.1, it is also possible to access x-caracal from x-bees:
- Click More next to Analytics at the top of the page -> click x-caracal:

Documentation: x-caracal documentation
Liveboards
Liveboards act like dashboards. They are collections of related charts and tables, that you monitor most often. On the Liveboards tab, you can see the liveboards you saved, as well as liveboards of other users, in case they shared them with you or a company you belong to:

Pre-installed Liveboards
There is a number of pre-installed Liveboards:
CDR-View 2.1
Starting from WMS 6.01.20220621.2, you can find CDR-View 2.1 Liveboard in the list of Liveboards (1) or access it from a dedicated CDR-View tab 2.1 (2):

CDR-View includes pre-configured reports that allows to monitor the call activity of the employees and get reports related to the number of calls, costs, call duration, usage of trunks, etc., and analyze the activity of call agents and response groups. For detailed information about requirements, available reports, etc. check out the document How to use CDR-View 2.0.
Starting from WMS 6.04, there are also x-hoppers reports. The data in the report is displayed only in case of a PBX with x-hoppers licenses and if there were e.g. active x-hoppers calls, broadcasts, help points usage.

Documentation: x-hoppers Analytics.
Meeting Analytics
The report is named MeetingView and allows you to monitor conference activity of employees including such data as the number of conferences, date and time, conference title, duration, number of participants and participants list etc.

Documentation: Meeting Analytics in x-bees
Conversations Analytics
The pre-installed Liveboard is named ChatView and allows to view information about conversations of PBX agents with external users.

Documentation: Conversations Analytics in x-bees
View a Liveboard
Click on the necessary liveboard from the list to see its details:

Note: Currently, to update data on a Liveboard, you need to refresh the page.
Manage Liveboards
Also, you can perform the following actions with a liveboard:
- Clicking on the Star icon next to the liveboard name, you can add it to favorites
- Lock icon indicates whether you have view only or edit access to the liveboard
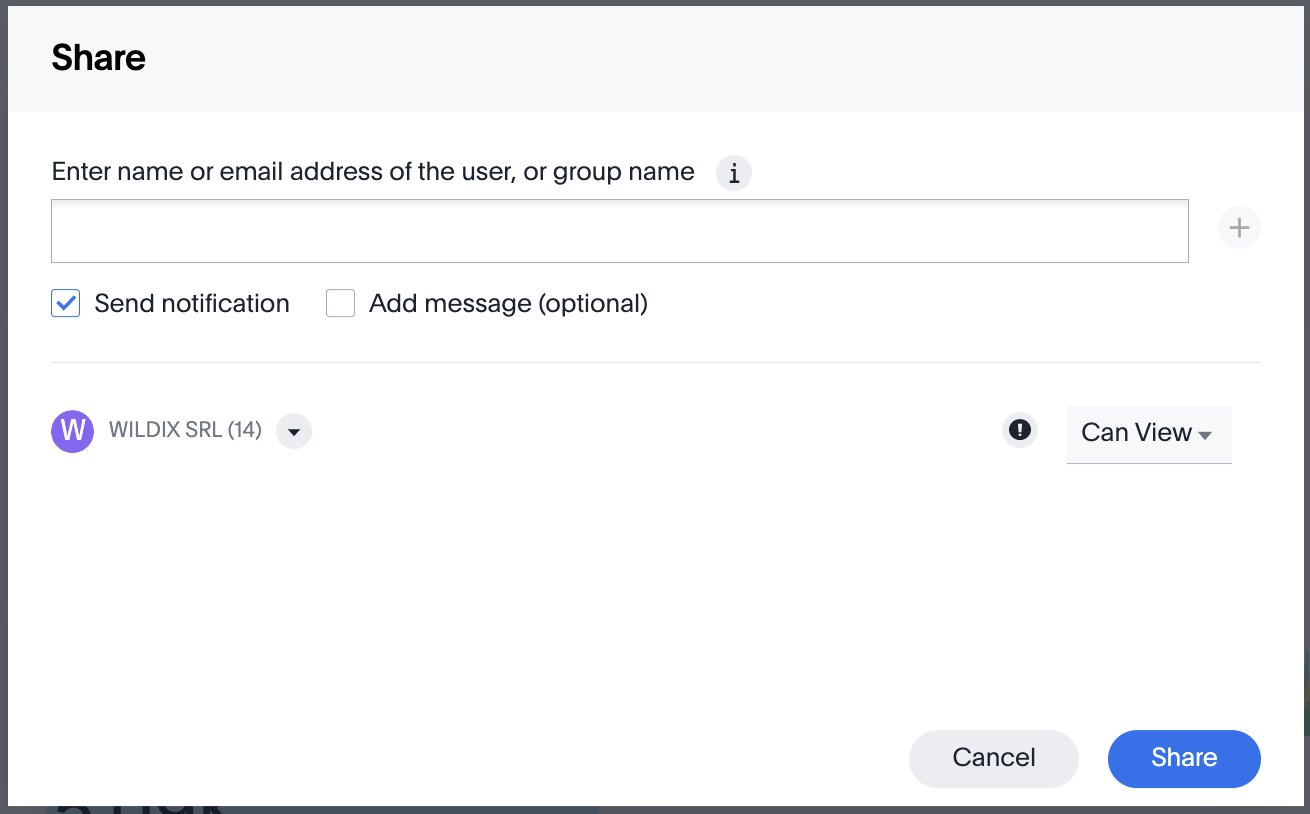
- If you want to share the liveboard with a user or group, click Share button, enter name or email address of user or group you want to share the liveboard with, select access right and click Share:
- Clicking More (three dots) button (1), you get access to the following options (2):

- Rename (edit access required)
- Make a copy
- Download PDF (edit access required)
- Present
- Create schedule
Liveboard scheduling allows to configure reports to be sent to email(s) at specified interval:
- Manage schedules
- Export TML
- Request verification (edit access required)
- Show Liveboard details
- Delete (edit access required)
Add visualizations
In case you’ve created a liveboard, but there are not answers yet, click the Search data button:

A Search field appears and you can start exploring the data you need. The same functionality described in the Search section of this guide is available on Liveboards tab.
Also, you can pin visualizations to the liveboard when you view an answer on the Search/ Answers/ Home tabs.
Explore answers on Liveboard
To view details of an answer on a liveboard, hover your mouse over the desired answer and click Explore:

The answer opens. Besides viewing its details, using the Explore this data panel on the right, you can modify the answer by applying additional filters, adding/ replacing columns, choosing data for comparison:
Search
On the Search tab, you can type in the search bar what information you want to explore and x-bees returns the search results in the form of a table or chart.
Data items (columns)
Search is based on the tables that exist in your data. Tables are made of rows and columns, like spreadsheets. You can search by typing in:
- Name of data item (column): like callee, connect time, talk time
- Special keywords: like today, yesterday, >, or contains
Click on the WDA button to the left of the search field to see the list of available data items:

The list of data items (columns) includes the following options:
- Average duration
- Callee
- Caller
- Calls
- Conferences
- Connect time
- Conversation ID
- Conversations
- Date
- Department
- Direction (values: inbound, internal, outbound)
- Duration
- Hangup (values: callee, caller)
- Maximum duration
- Name
Remote Country
Note: The following standard is used for country codes: ISO 3166-1 alpha-2. E.g.: IT, DE, US.
- Remote Phone
- Role (values: agent, client)
- Serial
- Service
- Session ID
- Speaker Time
- Status (values: completed, missed)
- Subject
- Talk time
- Time
- Total duration
- Total talk time
- Trunk
- Type (values: call, conference)
- Voicemails
- Wait time
Hovering a mouse over any of these items, you can see a tooltip with the following info: name, description, data source (if applicable), and data type:

To view available values of a data item, click on the filter icon next to it:

A pop-up window shows up, where you can view all available values of the data item:
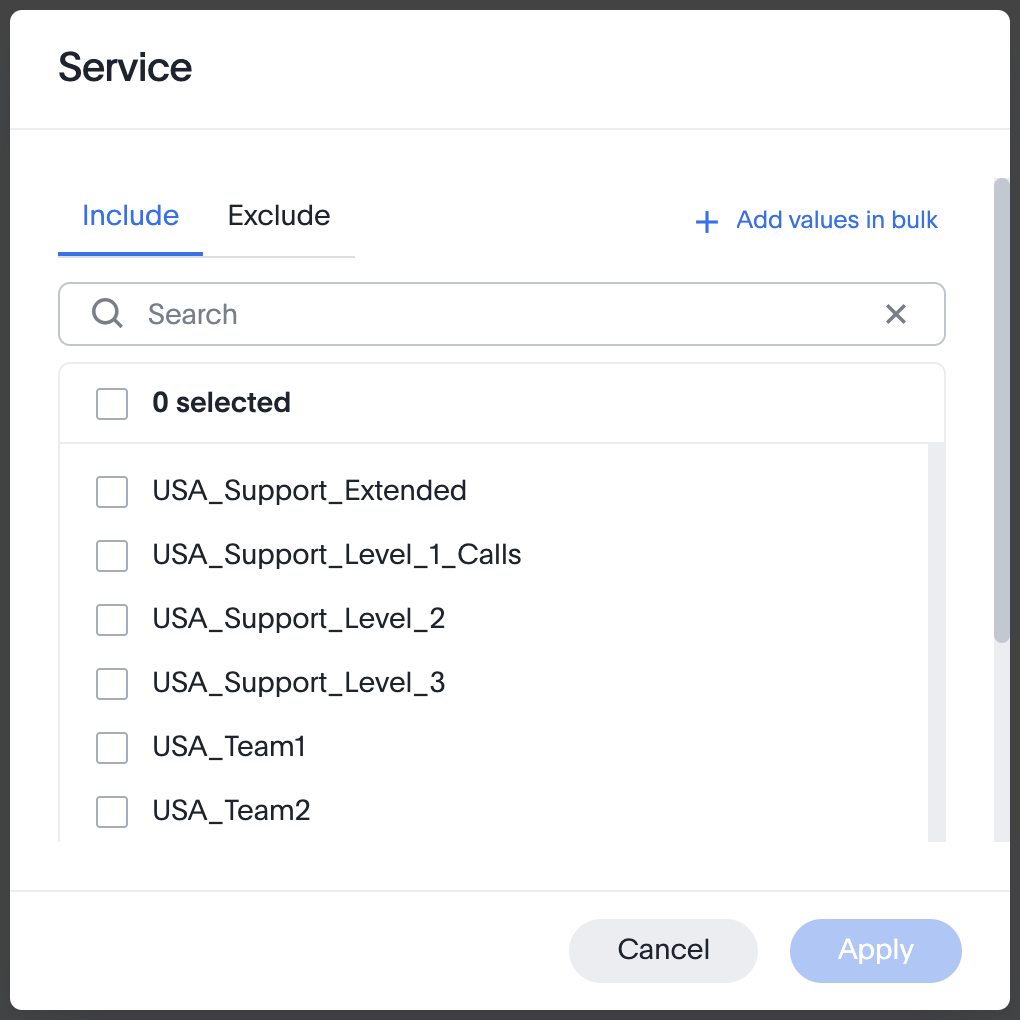
You can also choose values by which you want to filter data: tick off necessary values and click Apply and the selected values appear in the search field.
Start a new search
Click Search on the top navigation bar.
Start typing your search request, using necessary data items and keywords.
Alternatively, you can double-click on the preferred data items on the left-side panel and they are automatically added to the Search field. To add multiple items, click on the necessary items to select them and press + Add Columns:
Note: Typing in your search query, you may notice that search items are of different colours:
- blue = attributes: primarily text or date values. Usually, attributes make up the x-axis of your chart. Examples: caller name, call status, etc.
- green = measures: numeric values, e.g. duration of a call
- grey = filters, e.g. outbound, inbound

3. Once your search query is ready, press Enter on keyboard, or click Go to the right of the search bar:

Your search is given an automatic title based on your search columns, and is displayed as either a table or chart, depending on how it is best represented. You can change display of the search result to fit your needs.
Example:
If you type in the search request "Caller Callee Direction Status Duration Today", the system returns a table with total duration of calls including information about caller, callee, direction of calls (inbound/ outbound), and call status:

Edit a search
When you click a search phrase, it is highlighted, and x-bees displays other suggestions from which you can choose to replace the highlighted phrase. If, say, you want the same data to be displayed not for today only, but for last week, for example, start typing "last" in the search field and choose the preferred option:

When you hover over a boxed phrase, you can see an x, which you can click to remove it from the search:
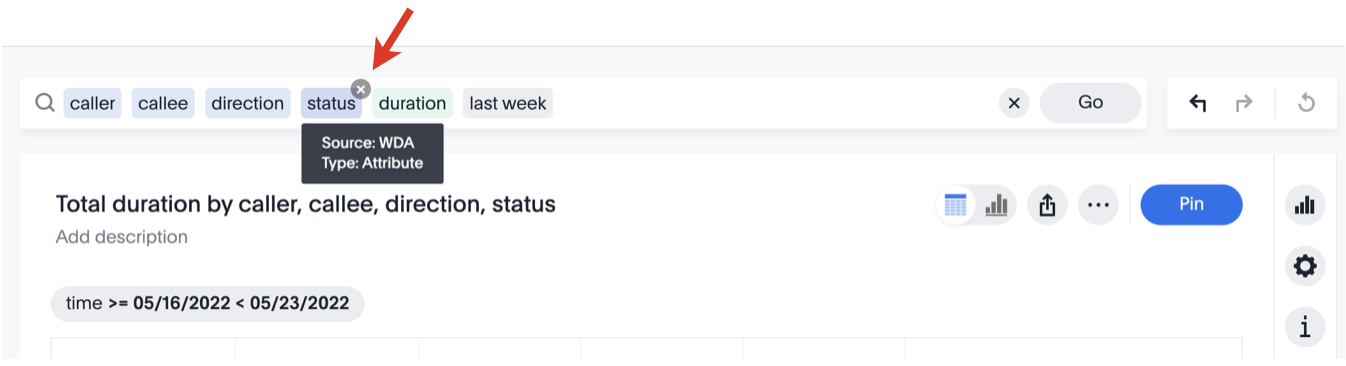
You can insert a new phrase in the middle of a search, by clicking between phrases and entering the new phrase. Also, you can merge phrases without breaking the search.
Also, you can add data items to your search request by selecting relevant items on the left (1) and click Add columns (2). Once added, click Go (3) in the Search field.

Note: In case a table or chart doesn’t seem to contain all the data you expect, try looking in the search bar for filters in gray boxes. Remove unnecessary filters, you get all available data for that search.
Display totals
To have total numbers displayed at the bottom of the report, click Edit chart configuration (1) -> go to Settings (2) -> enable the checkbox next to Column summary (3):
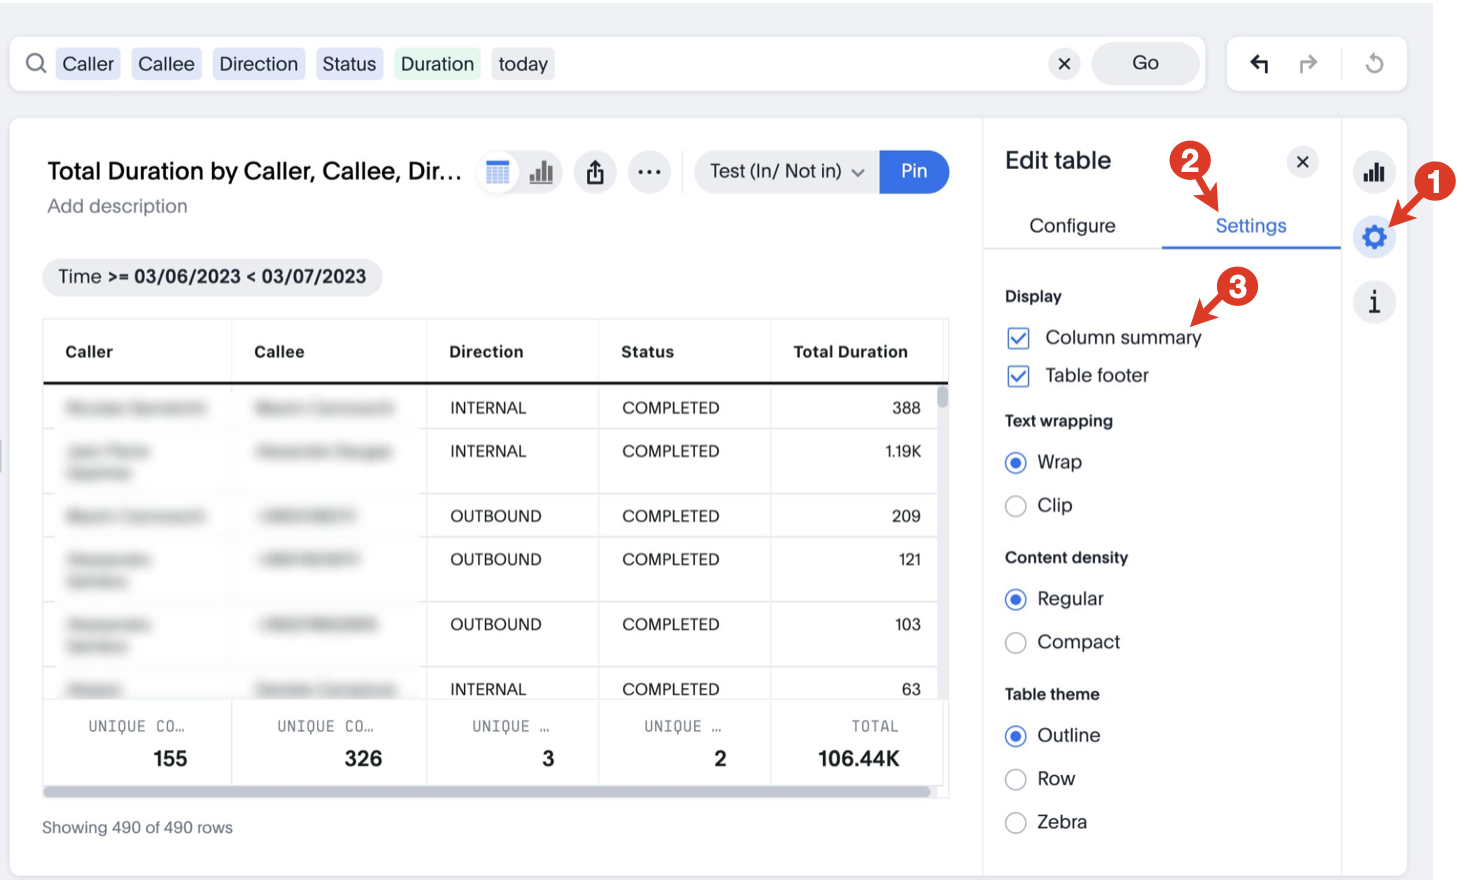
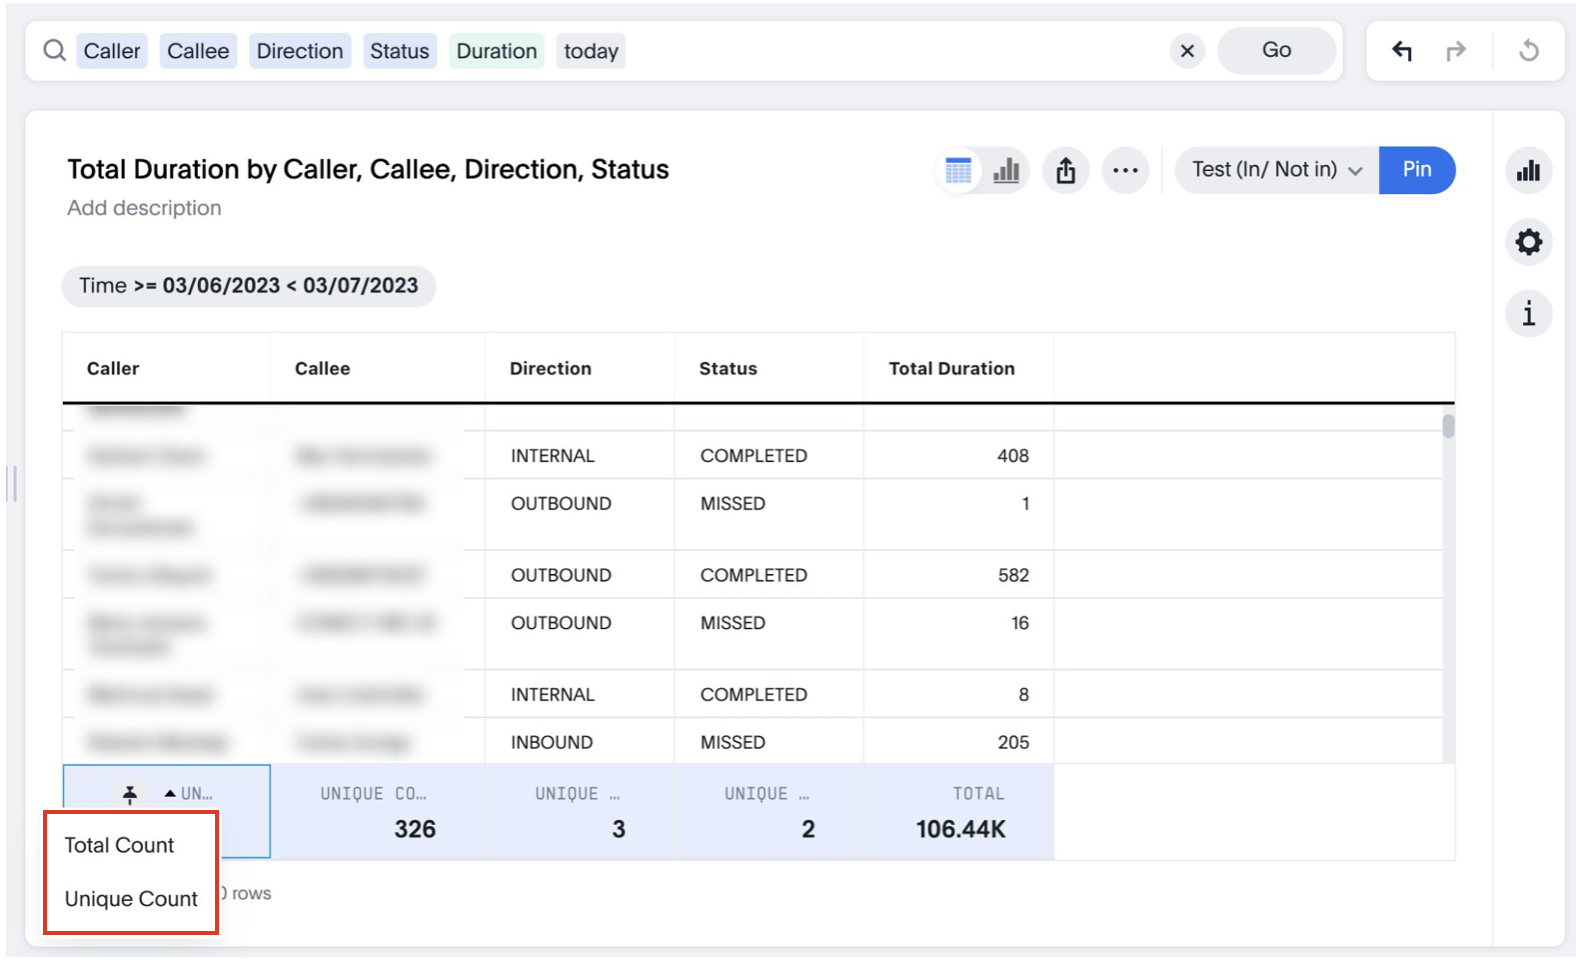
For non-numeric values it is possible to choose if you want to see Total Count or Unique Count (set by default):
View query details
To view details of the query, click on the Query details button (info icon) on the right:

Change display of an answer
Switch between table/ chart view
You can change the view of your answer so it appears as either a table or a chart. To change the view of your answer, toggle between either a table or a chart type:
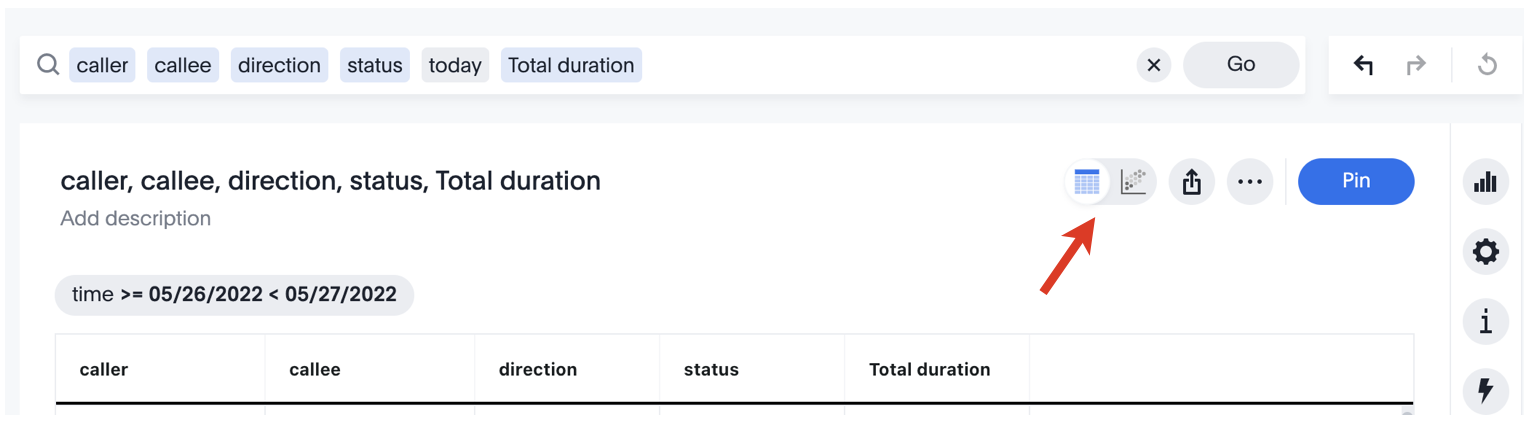
Your search needs at least one attribute and one measure to be presented as a chart. When you display your data as a chart, x-bees automatically selects the type of chart that works best for your data. If you want to use another type, click Change visualization (chart icon) on the right:

You can choose from a large number of chart types, each providing a different visualization for your answer. Select the type of chart you want:
Notes:
- Some chart types may not be available, depending on the columns in your search. Unavailable chart types are grayed out
Hovering over a chart type icon tells you what columns you require before you can use it:

Edit chart configuration
If you are not fully satisfied with how the chart looks like, you can easily modify it:
- Click the Edit chart configuration button on the right
- Configure which columns should be presented on X-axis or Y-axis, or modify other parameters presented in the settings:
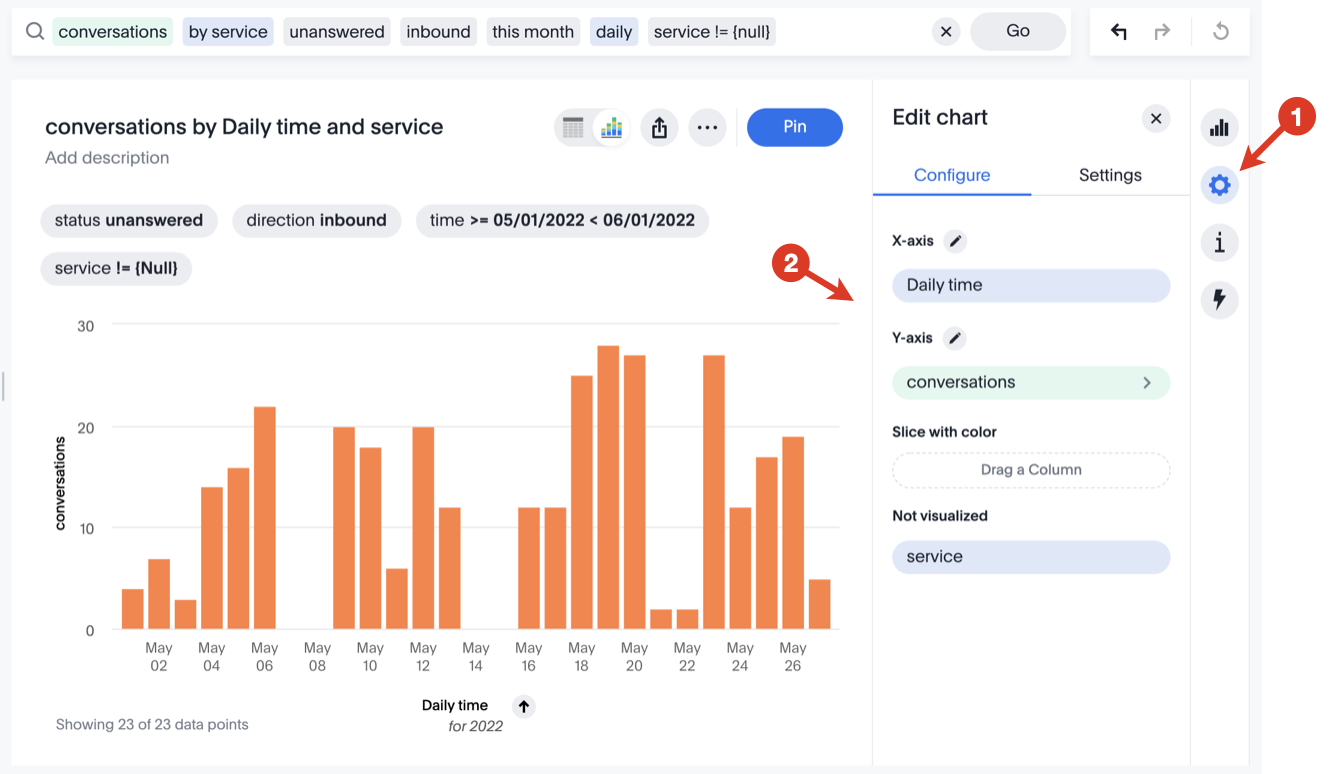
For example, for better visualization, let's slice the chart with color, for different services to be displayed with different colors on the chart. For this, we drag and from the service box under Slice with color option (1) and the chart changes its view to the following: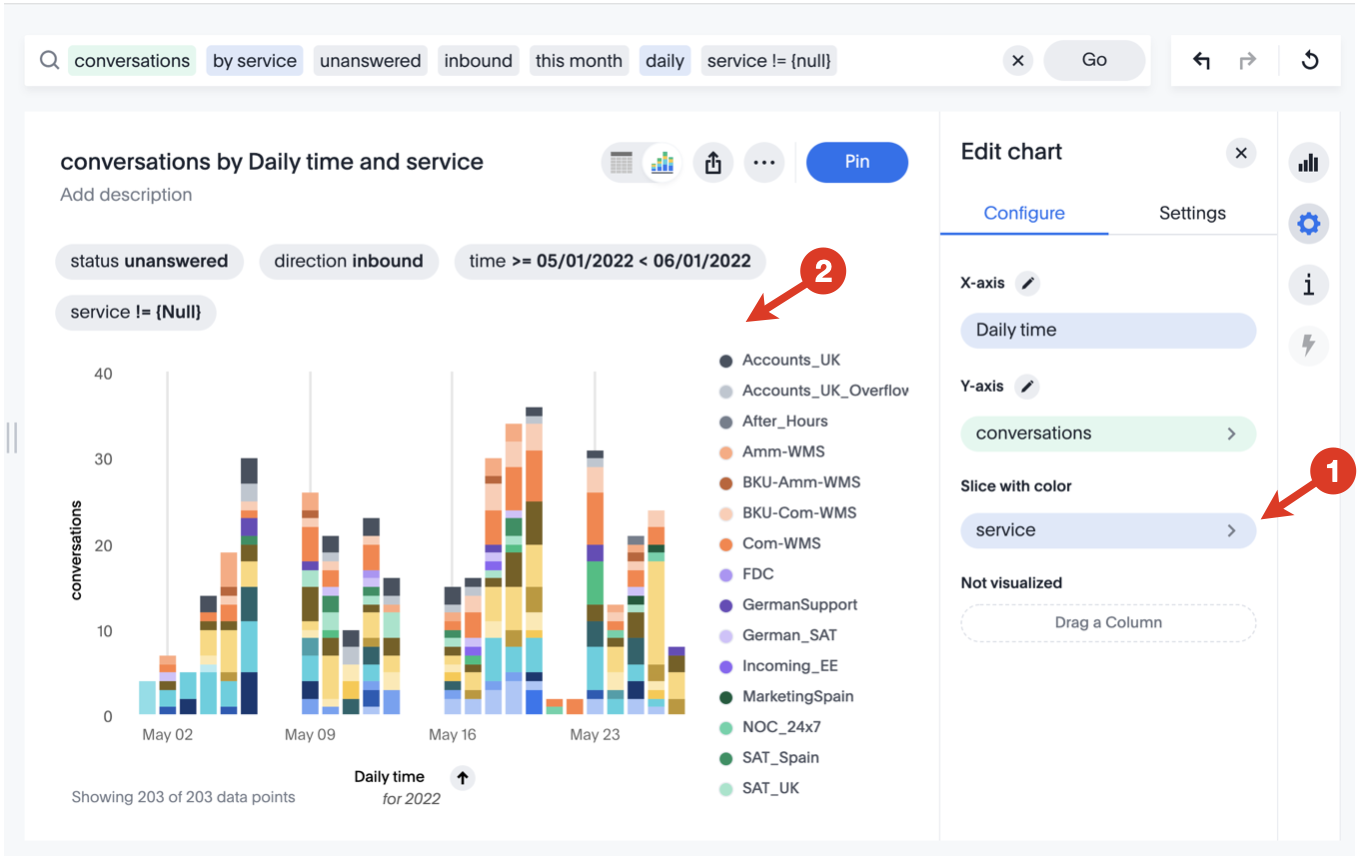
Drill down chart item
In the example on the screenshot above, we searched for unanswered incoming calls this month by service and chose the data to be displayed in a stacked column chart.
If, say, you need a more detailed information regarding any of the service/ group displayed in the chart, right-click on the necessary item on visualization (1) -> choose Drill down (2):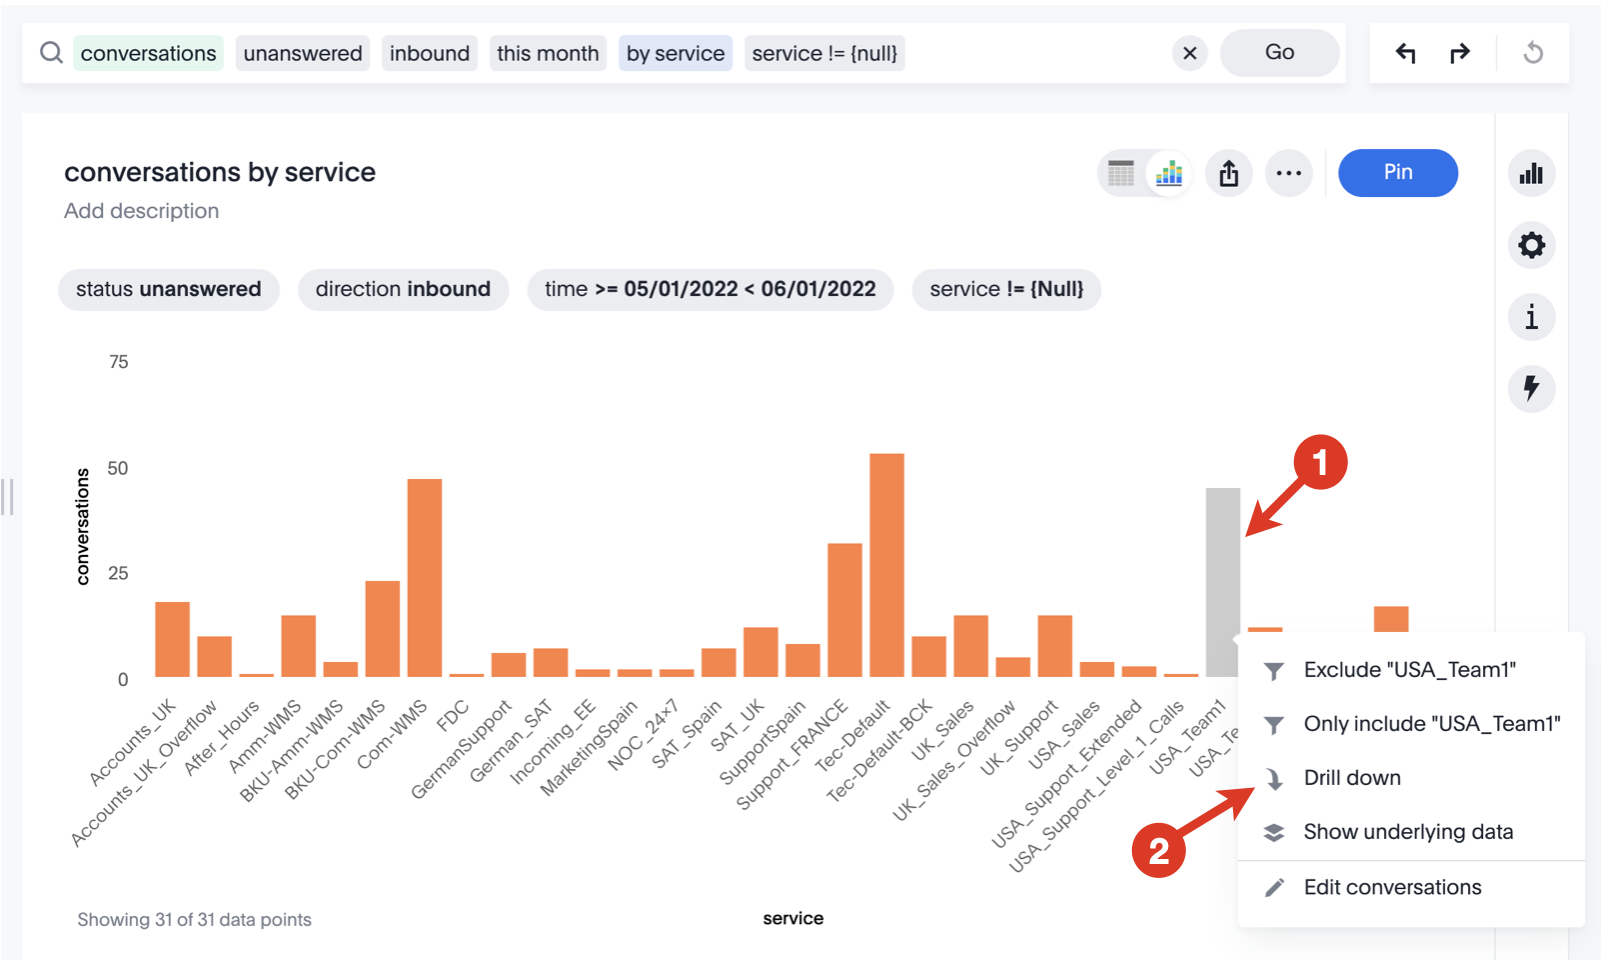
In the Drill down pop-up screen, choose the data you want to explore: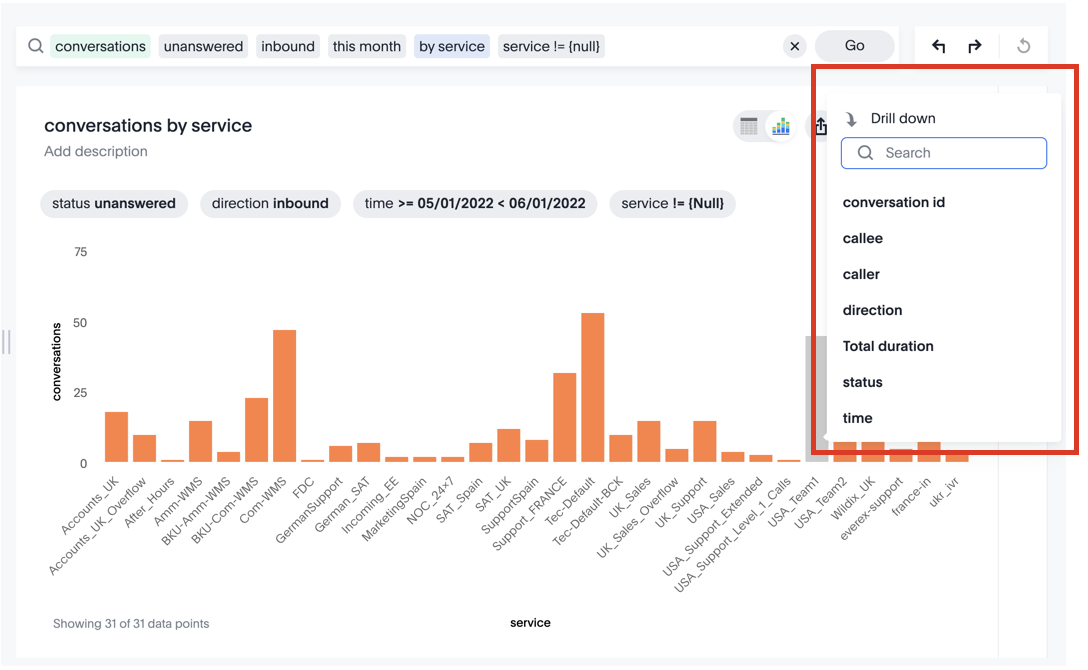
For example, if you select the option caller, x-bees returns the list of phone numbers, whose calls were missed by the chosen group, and how many calls were missed by each number:
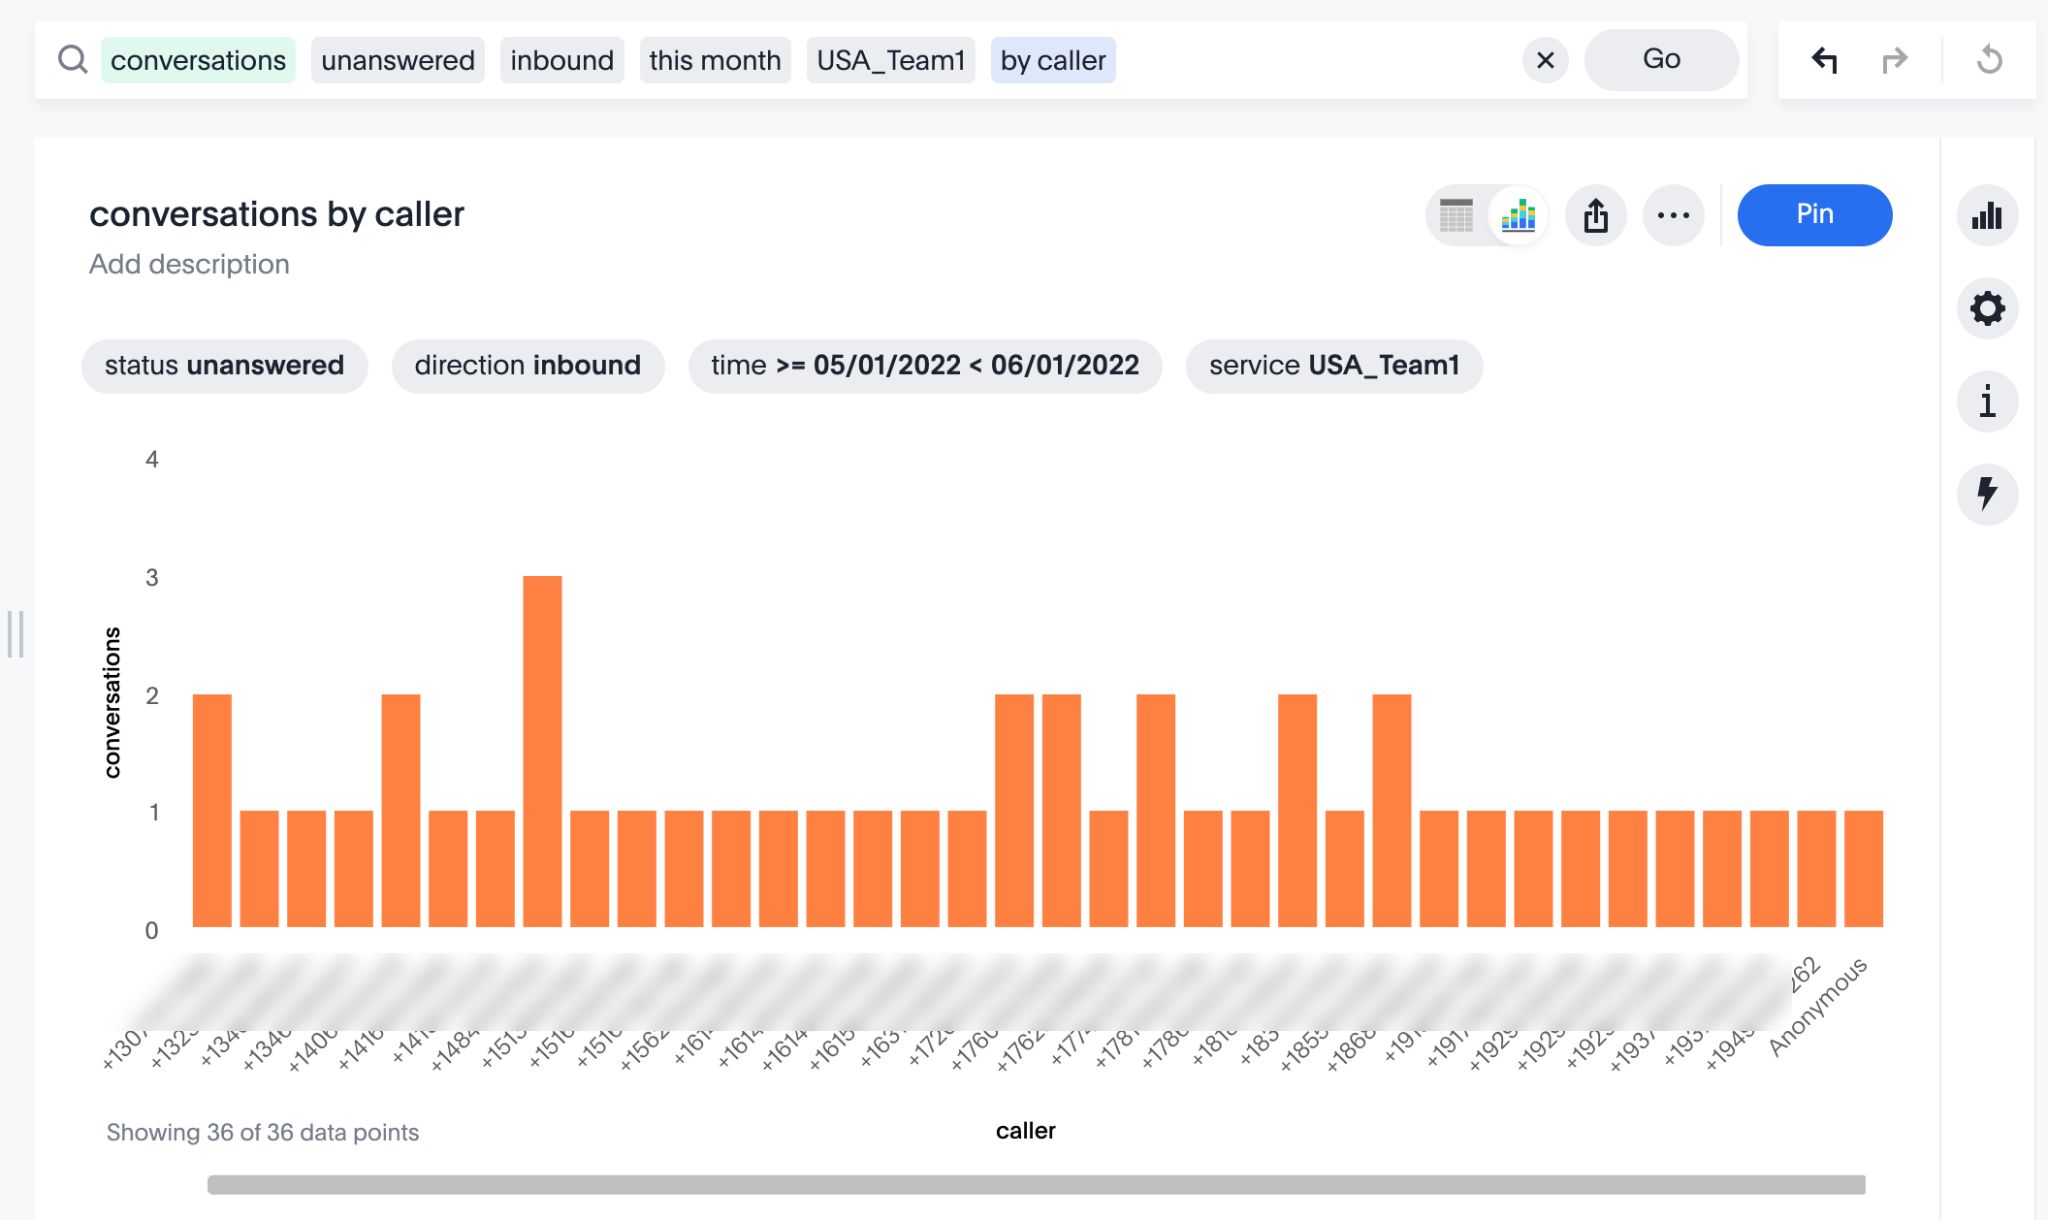
To return to the previous view of the chart, click back to the right of the search field: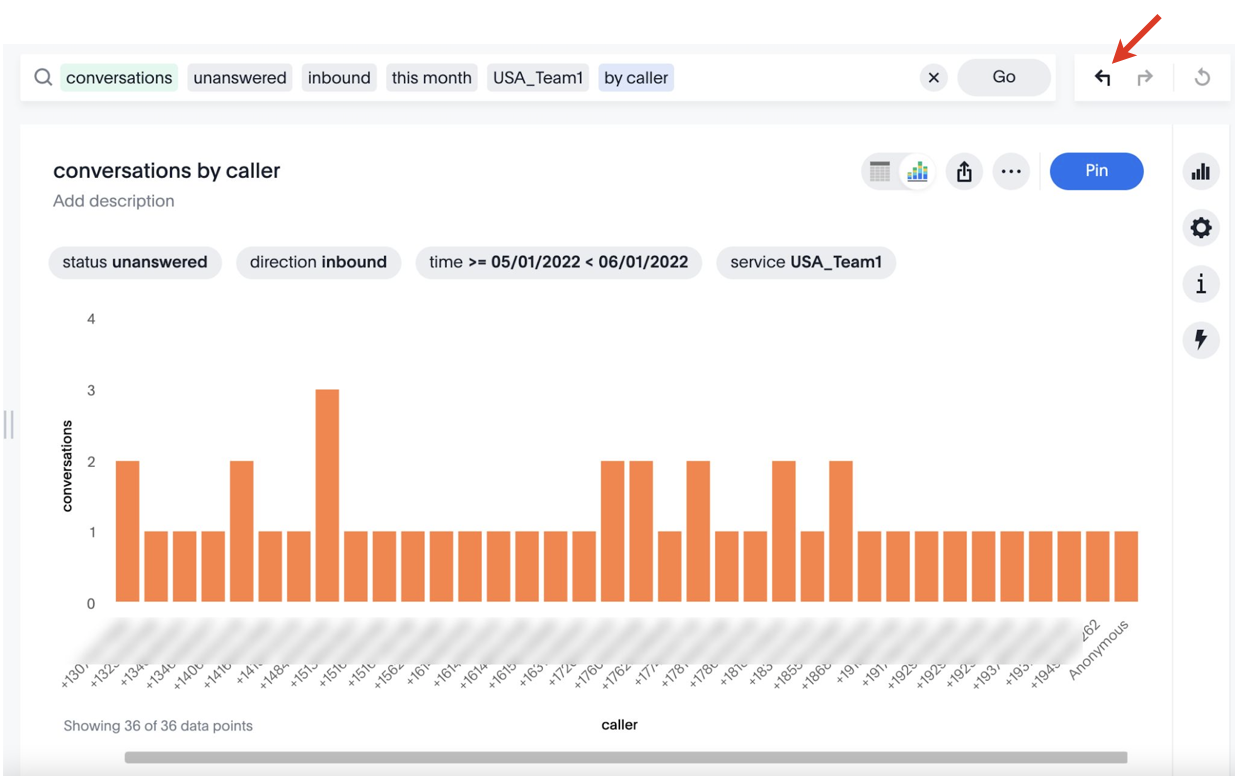
Exclude or include data
You can include or exclude row values from your answer.
To exclude or include row values:
- Right-click the necessary item on visualization or table cell
- Click Exclude "value" or Only Include "value" if available

Save an answer
An answer is the result of a single search. You can save an answer you want to work more on later, or just keep it for your personal use.
Click on the More (three dots) button at the top and choose Save:

Enter name and description and click Save answer:
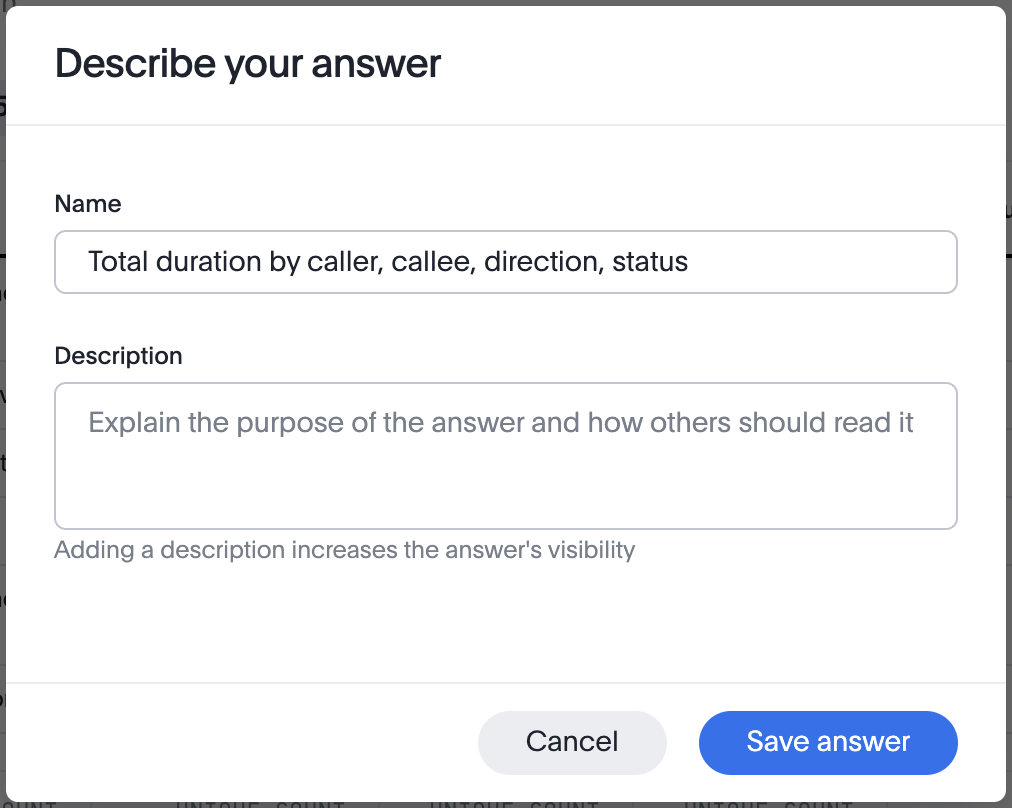
The saved answer is added to the x-bees Analytics#Answers tab.
Pin an answer
To add an answer to Liveboards tab, which contains a collection of answers in a pinboard (dashboards) view:
- Click on the Liveboard name next to the Pin button to select the Liveboard you want to pin the answer to:

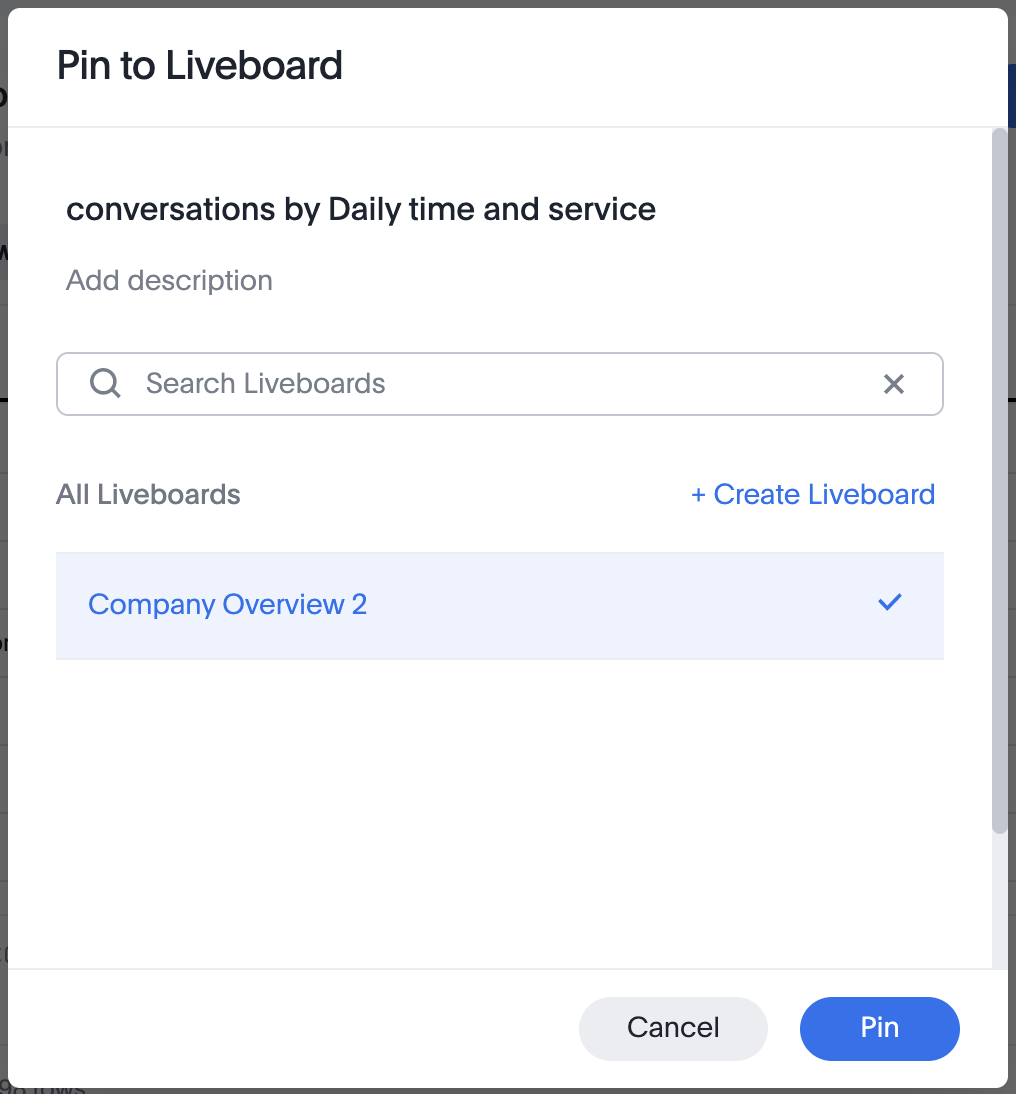
- Search for the necessary Liveboard or create a new one:
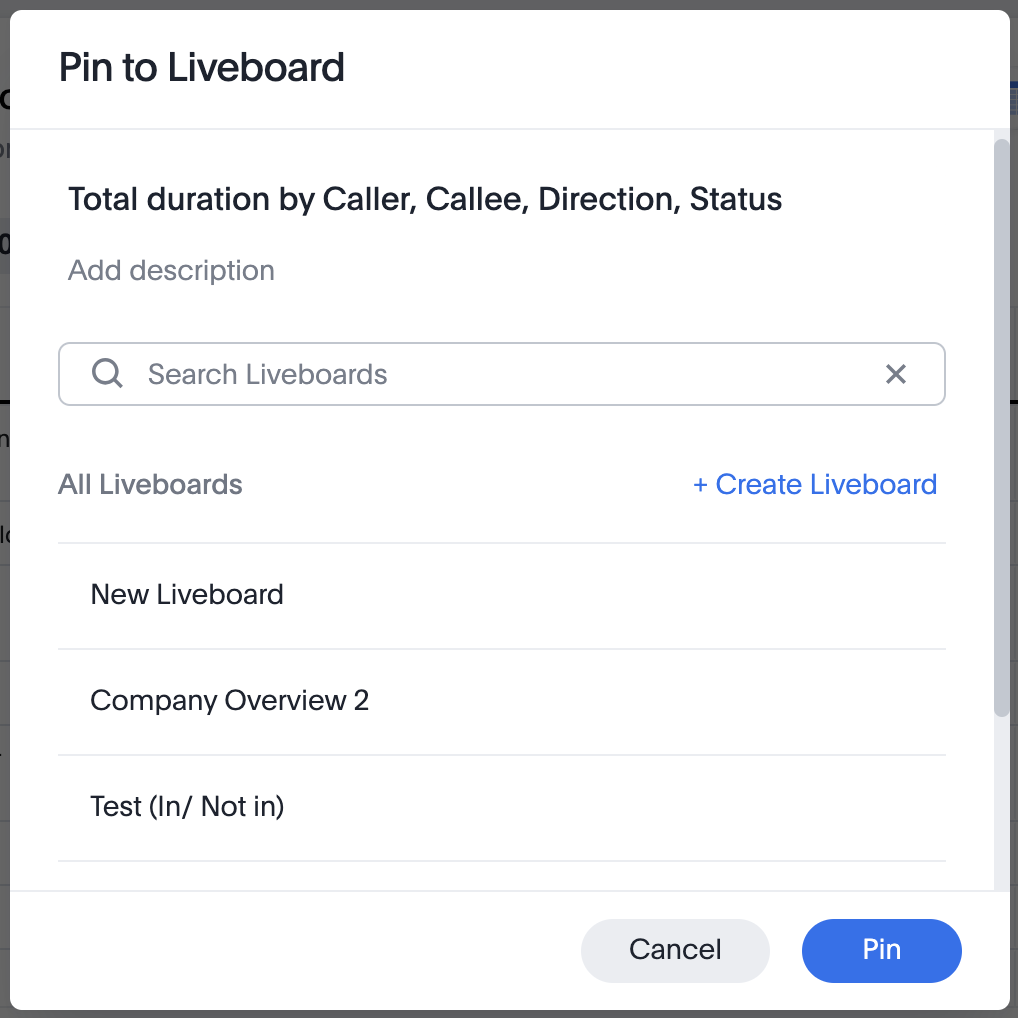
- Click Pin:
Answers
An answer is the saved result of a search. On the Answers tab, you can see the answers you saved, as well as answers of other users, in case they shared them with you or a company you belong to.
If you tick the checkbox next to an answer, the following buttons appear above the answers list:
- Share: allows to share the answer with other users or groups
- Delete (personal answers only): deletes the answer
- Edit Tags (personal answers only): allows to tag the answer

Clicking on an answer, it opens in a table/ chart view with the same editing options described in the Search section of this guide:

Keyword reference
Keywords help to define a search.
General
Note: When using the top or bottom keywords without specifying a number (n), the number defaults to 10.
| Keyword - English | IT | DE | FR | ES | Description |
|---|---|---|---|---|---|
top n | superiore n | top n | haut n | primeros n | Generates the top n items from a sorted result. Example: caller callee direction status duration today top 5 |
top n measure1 by attribute|measure2 | superiore n per | top n nach | haut n par | primeros n por | Calculates top n items, then sorts the top items by another measure or attribute. Contrast with top n (swaps the order of operations). Example: top 10 caller by conversations this month |
| bottom n | inferiore n | bottom n | bas n | últimos n | Generates the bottom n items from a sorted result. Example: bottom 10 caller by conversations this month |
| sort by | ordina per | sortieren nach | trier par | ordenar por | Sorts the result set by an attribute or measure. Example: caller callee direction status duration today sort by duration |
| by <measure> | per | nach | par | por | Treats the measure as an attribute and groups the result set by it. Example: conversations by day |
Date
| Keyword | IT | DE | FR | ES | Examples |
|---|---|---|---|---|---|
| after | dopo | nach dem | après | después de | conversations after 10/31/2022 |
| before | primo | vor dem | avant | antes de | conversations before 03/01/2022 |
between ... and ... | tra … e … | zwischen dem … und dem … | entre … et … | entre … y … | conversations between 01/30/2022 and 01/30/2022 |
| day | giorno | Tag | jour | día | conversations monday |
day of week | giorno della settimana | Tag der Woche | jour de la semaine | día de la semana | conversations by day of week last 3 months |
| growth of … by ... | crescita di … su base … | wachstum von … pro… | croissance de … par … | crecimiento de … hasta … | growth of conversations by time last month unanswered |
| growth of … by … daily | crescita di … su base … giornaliero | wachstum von … pro… täglich | croissance de … par … tous les jours | crecimiento de … hasta … a diario | growth of conversations by time daily last month unanswered |
| growth of … by … monthly | crescita di … su base … mensile | wachstum von … pro … monatlich | croissance de … par … tous les mois | crecimiento de … hasta … mensual | growth of conversations by time monthly unanswered |
| growth of … by … quarterly | crescita di … su base … trimestrale | wachstum von … pro … vierteljährlich | croissance de … par … tous les trimestres | crecimiento de … hasta … trimestral | growth of conversations by time quarterly unanswered |
| growth of … by … weekly | crescita di … su base … settimanale | wachstum von … pro … wöchentlich | croissance de … par … toutes les semaines | crecimiento de … hasta … semanal | growth of conversations by time weekly last month unanswered |
| last day by | ultimo giorno su base | am letzten Tag pro | dernier jour par | último día hasta | conversations last day by callee |
| last month | ultimo mese | letzte n Monate | dernier mois | último mes | conversations last month by callee |
last month by | ultimo mese su base | im letzten Monat pro | dernier mois par | último mes hasta | conversations last month by day |
| last n days | ultimo n giorni | letzte n Tage | dernier n jours | últimos n días | conversations last 7 days |
| last n months | ultimo n mesi | letzte n Monat | dernier n mois | último n meses | conversations last 10 months by day |
| last n quarters | ultimo n trimestri | letzte n Quartale | dernier n trimestres | últimos n trimestres | conversations last 2 quarters by month by service |
| last n weeks | ultimo n settimane | letzte n Wochen | dernier n semaines | últimas n semanas | conversations last 10 weeks by day |
last quarter | ultimo trimestre | letzte Quartal | dernier trimestre | último trimestre | conversations last quarter |
| last week | ultimo settimana | letzte Woche | dernier semaine | última semana | conversations last week by service |
| last year | ultimo anno | letzte Jahr | dernier année | último año | conversations last year by callee |
| month | mese | Monat | mois | mes | conversations by month last year conversations January |
| month to date | mese finora | Monat bis jetzt | mois à ce jour | mes hasta la fecha | conversations month to date |
month year | mese anno | Monat Jahr | mois année | mes año | conversations by service February 2022 |
| n days ago | n giorni fa | vor n Tagen | n jours il y a | n días hace | conversations 2 days ago |
| last n days for each month | n giorni per ogni mese | n Tage in jeder Monat | n jours pour chaque mois | n días para cada mes | conversations 2 days for each month |
| last n days for each quarter | n giorni per ogni trimestre | n Tage in jeder Quartal | n jours pour chaque trimestre | n días para cada trimestre | conversations last 15 days for each quarter |
| last n days for each week | n giorni per ogni settimana | n Tage in jeder Woche | n jours pour chaque semaine | n días para cada semana | conversations last 2 days for each week |
| last n days for each year | n giorni per ogni anno | n Tage in jeder Jahr | n jours pour chaque année | n días para cada año | conversations last 30 days for each year |
| last n hours for each day | n ore per ogni giorno | n Stunden in jeder Tag | n heures pour chaque jour | n días para cada año | conversations last 2 hours for each day |
| n months | n mesi | n Monaten | n mois | n meses | conversations last 6 months |
| n months ago | n mesi fa | vor n Monaten | n mois il y a | n meses hace | conversations 2 months ago by service |
last n months for each quarter | n mesi per ogni trimestre | n Monate in jeder Quartal | n mois pour chaque trimestre | n meses para cada trimestre | conversations last 2 months for each quarter |
| last n months for each year | n mesi per ogni anno | n Monate in jeder Jahr | n mois pour chaque année | n meses para cada año | conversations last 8 months for each year |
| n quarters ago | n trimestri fa | vor n Quartalen | n trimestres il y a | n trimestres hace | conversations 4 quarters ago by service |
| n weeks ago | n settimane fa | vor n Wochen | n semaines il y a | n semanas hace | conversations 4 weeks ago by callee |
| last n weeks for each month | n settimane per ogni mese | n Wochen in jeder Monat | n semaines pour chaque mois | n semanas para cada mes | conversations last 3 weeks for each month |
| last n weeks for each quarter | n settimane per ogni trimestre | n Wochen in jeder Quartal | n semaines pour chaque trimestre | n semanas para cada trimestre | conversations last 2 weeks for each quarter |
quarter to date | trimestre finora | Quartal bis jetzt | trimestre ce jour | trimestre hasta la fecha | sales by product quarter to date for top 10 products by sales |
| this day | questo giorno | diese Tag | ce jour | este día | conversations this day by callee |
this month | questo mese | diese Monat | ce mois | este mes | conversations this month by day |
| this quarter | questo trimestre | diese Quartal | ce trimestre | este trimestre | conversations this quarter by callee |
| this week | questo settimana | diese Woche | ce trimestre | este semana | conversations this week by service |
| this year | questo anno | diese jahr | ce année | este año | conversations this year by callee |
| today | oggi | heute | aujourd’hui | hoy | conversations today by callee |
| week | settimana | Woche | semaine | semana | conversations by week last quarter |
| week to date | settimana finora | Woche bis jetzt | semaine à ce jour | semana hasta la fecha | conversations week to date by callee |
| year | anno | Jahr | année | año | conversations by callee 2022 |
year to date | anno finora | Jahr bis jetzt | année à ce jour | año hasta la fecha | conversations by callee year to date |
| yesterday | ieri | gestern | hier | ayer | conversations by callee yesterday |
Time
| Keyword | IT | DE | FR | ES | Examples |
|---|---|---|---|---|---|
| detailed | dettagliato | detailliert | détaillée | detallado | conversation time detailed |
| last hour | ultimo ora | letze Stunde | dernier heure | último hora | count unique conversations last hour |
| last minute | ultimo minuto | letzte minute | dernier minute | último minuto | count conversations last minute |
| n hours | n ore | n Stunden | n heures | n horas | count conversations [ last ] 12 hours |
| n hours ago | n ore fa | n Studen vor | n heures il y a | n horas hace | conversations 2 hours ago |
| n minutes | n minuti | n minuten | n minutes | n minutos | count conversations [ last ] 30 minutes |
| n minutes ago | n minuti fa | n minuten vor | n minutes il y a | n minutos hace | sum conversations by service 10 minutes ago |
| this hour | questo ora | diese stunde | ce heure | este hora | conversations this hour |
| this minute | questo minuto | diese minute | ce minute | este minuto | conversations this minute |
Text
| Keyword | IT | DE | FR | ES | Examples |
|---|---|---|---|---|---|
| begins with | inizia con | beginnt mit | commence par | empieza por | conversations name begins with 'joe' by name // returns the list of conversations that have name starting with 'Joe' |
| contains | contiene | enthält | contient | contiene | conversations name contains 'bill' by name |
| ends with | finisce con | endet mit | se termine pas | termina por | conversations name ends with 'joe' |
| similar to | simile a | ähnlich zu | similaire à | similar a | conversations name similar to 'joseph' |
| not begins with | non inizia con | beginnt nicht mit | ne commence pas par | no empieza por | conversations name not begins with 'bill' |
| not contains | non contiene | enthält nicht | ne contient pas | no contiene | conversations name not contains 'joe' |
| not ends with | non finisce con | endet nicht mit | ne termine pas par | no termina por | conversations name not ends with 'joe' |
| not similar to | diverso da | nicht ähnlich zu | pas similaire à | no es similar a | conversations name not similar to 'hand' |
Notes:
- When more than one
begins withorends withkeyword in a search or formula on the same column is used, results are returned using anORcondition. When you use a combination of
begins withandends with, results are returned using theANDcondition.When using multiple
begins withon different columns, results are returned using theANDcondition.
For example, if you search for state name begins with "V" state name begins with "C", your results are: Virginia, Vermont, California, and Connecticut.
If you search for state name begins with V state name ends with T, your only result is Vermont.
Number
| Keyword | IT | DE | FR | ES | Examples |
|---|---|---|---|---|---|
| average | media | Durchschnitt | moyenne | promedio | conversations average duration by service this month |
| count | conteggio | Anzahl | nombre | recuento | count service unique count caller by service |
max | max | Maximum | max | máx | max talk time conversations by service |
| min | min | Minimum | min | mín | min wait time by service |
| standard deviation | deviazione | Standardabweichung | écart type | desviación estándar | standard deviation conversations by service by week month to date |
| sum | somma | Summe | somme | suma | sum talk time by service today |
| unique count | conteggio univoco | eindeutige Anzahl | nombre unique | recuento único | unique count conversation id |
| variance | varianza | Varianz | variance | varianza | variance duration by service |
Comparative
| Keyword | IT | DE | FR | ES | Examples |
|---|---|---|---|---|---|
| all | tutto | alle | tout | todo/a | conversations uk_support vs all Note: The "all" keyword can only be used as part of a versus phrase. |
| between... and... | tra … e | zwischen … und | entre … et | entre … y | inbound calls wait time between 60 and 120 |
= (equal) | = | = | = | = | conversations by callee duration = 0 |
| everything | tutto | alles | tout | todo/a | conversations uk_support vs everything Note: The "everything" keyword can only be used as part of a versus phrase. |
| > (greater than) | > | > | > | > | conversations by callee wait time > 60 |
>= (greater than or equal) | >= | >= | >= | >= | conversations by callee wait time >= 60 |
< (less than) | < | < | < | < | conversations by callee wait time < 60 |
<= (less than or equal) | <= | <= | <= | <= | conversations by callee wait time <= 60 |
!= (not equal) | != | != | != | != | caller callee direction status duration today callee !={null} |
vs, versus | risp. a, rispetto a | vs, versus | vs, versus | vs, contra | conversations uk_support vs us_support |
You can use special constants for null and empty values with the = and != keywords: {null} and {empty}.
For example: service != {null}.
Period
| Keyword | IT | DE | FR | ES | Examples |
|---|---|---|---|---|---|
| day | giorno (date) | Tag (date) | jour (date) | día (date) | conversations by day |
| day of month | giorno del mese (date) | Tag des Monats (date) | jour du mois (date) | día del mes (date) | conversations day of month by month |
| day of quarter | giorno del trimestre (date) | Tag des Quartals (date) | jour du trimestre (date) | día del trimestre (date) | conversations day of quarter by year |
day of week | giorno della settimana (date) | Tag der Woche (date) | jour de semaine (date) | día de la semana (date) | conversations by week day of week |
| day of year | giorno dell’anno (date) | Tag des Jahres (date) | jour de l’année (date) | día del año (date) | conversations day of year by year |
| hour | ora (datetime) | Stude (datetime) | heure (datetime) | hora (datetime) | conversations by hour weekly |
| month of quarter | mese del trimestre (date) | Monat des Quartals (date) | mois du trimestre (date) | mes del trimestre (date) | conversations month of quarter by year |
| quarter | trimestre (date) | Quartal (date) | trimestre (date) | trimestre (date) | conversations by quarter |
quarter of year | trimestre dell’anno (date) | Quartal des Jahres (date) | trimestre de l’année (date) | trimestre del año (date) | conversations quarter of year |
| week of month | settimana del mese (date) | Woche des Monats (date) | semaine du mois (date) | semana del mes (date) | conversations week of month |
| week of quarter | settimana del trimestre (date) | Woche des Quartals (date) | semaine du trimestre (date) | semana del trimestre (date) | conversations week of quarter |
week of year | settimana dell’anno (date) | Woche des Jahres (date) | semaine de l’année (date) | semana del año (date) | conversations week of year |
In / Not in
| Keyword | IT | DE | FR | ES | Description |
|---|---|---|---|---|---|
| in | in | in | dans | en | Query in query search (intersection of two sets). Must match last attribute before keyword with first attribute inside subsearch. Syntax: attribute in (attribute subsearch) Example: calls caller in (top 10 caller by calls today) week to date |
not in | not in | not in | not in | not in | Relative complement of two sets. Must match last attribute before keyword with first attribute inside subsearch. Syntax: attribute not in (attribute subsearch) Example: calls caller not in (top 10 caller by calls today) week to date |
Note: Searches with the in keyword do not include {null} values. To include {null} values, create a formula for the relevant attribute in your search, to convert {null} values to 'unknown,' or some similar word.