CDR-View User Guide
Wildix CDR-View is an extension of Wildix Collaboration, it serves to monitor in real time the call activity of the employees and provides online and offline reports related to the number of calls, costs, call duration, usage of trunks, etc, and allows you to analyze the activity of call agents and response groups.
Updated: August 2023
Permalink: https://wildix.atlassian.net/wiki/x/3xbOAQ
Important: With the release of Analytics (CDR-View 2.0), which covers the functionality of CDR-View, there are no further updates planned for CDR-View.
CDR-View reaches end of life on December 31, 2024. Its functionality is substituted by Cloud Analytics (CDR-View 2.0) in Collaboration and CDR-View 2.0 Liveboard in x-bees.
Check out documentation for more details: Cloud Analytics (CDR-View 2.0) in Collaboration, CDR-View in x-bees
Requirements
OS:
- Mac OS X 10.11 and higher
- Microsoft Windows 10 and higher
Web Browser:
- Google Chrome
- Safari
- Mozilla Firefox
(use the last stable version of the browser)
Wildix applications:
- Collaboration with UC-Premium License, more information https://www.wildix.com/licensing/
Internet connection:
- Internet connection is required to start CDR-View and to sync the last events; once the sync is performed (you can select the period for the sync), you can work offline
WMS configuration:
- Backend must be configured in Settings -> PBX -> Call and Chat history
- For call cost information, pricelists must be uploaded in Trunks -> Pricelists and associated to trunks used for outgoing calls
Note: you can limit access to CDR-View via ACL groups, more information ACL rules and Call classes management Guide.
Temporary limitation:
- You can open only one CDR-View instance on one PC
Launch CDR-View
Download CDR-View launcher
The first time you launch CDR-View, you are invited to download the Integration Service.
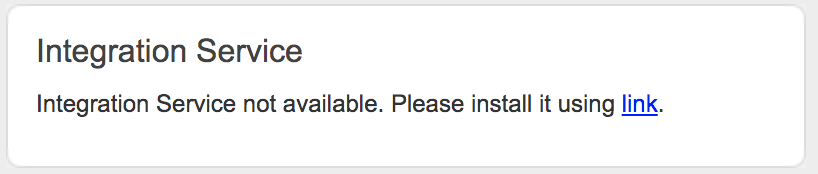
Once the download is finished, install the application.
Start CDR-View:
- Collaboration top menu -> Other -> CDR-View
- Collaboration History -> CDR-View button
Create reports
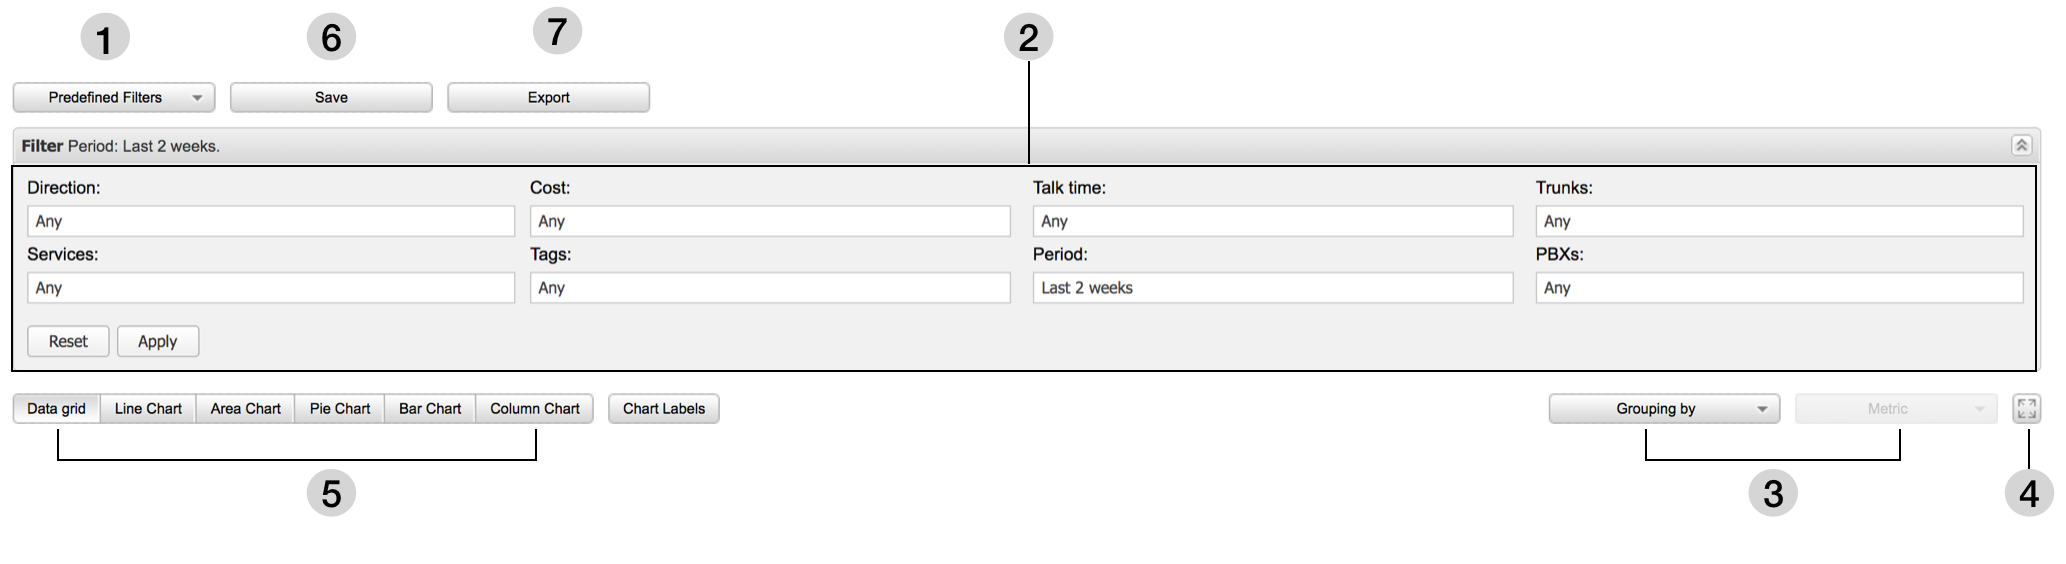
1 – Predefined filters: a selection of ready filters allowing you to create a report
2 – Filter section: manually adjust the filters to match your search criteria
3 – Grouping by / Metrics: after have applied filters, you can choose how to group the results, then select the Metrics parameter for analysis (Count of events; Cost of events; Talk time of events)
4 – Full screen mode: activate / deactivate
5 – View report in the form of data grid / charts (5 types)
6 – Save your report: you must specify the name of your report, add description; it’s possible to share your report with other users)
7 – Export your report: datagrid can be exported into .xls / .csv; charts are exported in .png format (the max number of records is up to 500 000)
Predefined filters
- Call list (Today / This week / This month): a quick overview of call activity
- By time (Today / This week / This month / This year)
- By group (Today / This week / This month)
- By trunk (Today / This week / This month)
- External calls (Failed outgoing / Missed / Sent faxes / Received faxes / Voicemail)
- Outgoing calls by (Country / Call class)
- Incoming calls by (Country / Call class)
- Cost by (User / Group / Trunk / Call Class / Destination)
- Trunk usage by group (Today / This week / This month)
In addition:
- Shared reports: load reports previously saved and shared by you or another user
- Personal: load personal reports previously saved by you
Filter section
- Direction (Internal to External / External to Internal / Internal to Internal): it is possible to search by number / group / contact / pattern
- Services (Call / Fax / Voicemail)
- Cost (specify the cost range)
- Tag (select tags); note: tags can be added in WMS Settings -> PBX -> Call and chat history)
- Talk time (specify the talk time period)
- Period (specify the time range)
- Trunks (select the trunks)
- PBXs (select PBX in WMS Network); note: filter is available if you have more than 1 PBX
How-to:
- Clear the filters: click Reset
- Display the results: click Apply
Direction filter: search by number/ group/ contact/ pattern
Search by number / group / contact name: type the data into the input field as illustrated on the screenshot below and click on “+”; otherwise tick off the check box.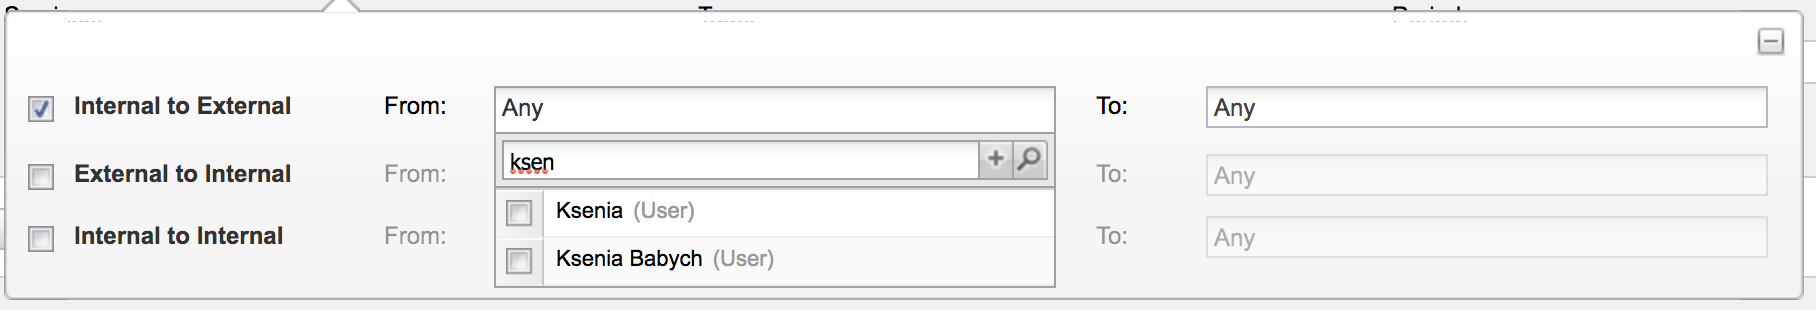

Search by pattern: use the % symbol (supported formats: %X, X%, %X%, example: 55% matches any number starting with 55; %55 matches any number finishing with 55; %55% matches any number containing 55).
Grouping by / Metrics
Any report needs at least two parameters for analysis, CDR-View allows you to select by which parameter to group the events (By day / user / company / etc) and to select the Metrics for events analysis (by Cost / by Talk time / by Quantity).
Grouping by: Hour / Hour of the day / Day / Day of the week / Week / Month / Month of the year / year / User / Group / Business partner / Company / Number / Trunk / Tag / Country / Class / Between Users / Between Groups.
Metrics: Count of events (Count / Count by service / Count by status / Count by destination / Count by SLA); Cost of events (Cost / Cost by service / Avg. cost by service); Talk time of events (Talk time / Talk time by direction / Avg. talk time by direction).
View report in the form of Data Grid / Chart
Data grid (default):
- once Grouping is applied, data is grouped by the selected parameter and default Metrics are displayed (Count of events – Count; Cost of events – Cost; Talk time of events – Talk time), you can change “Metrics”
Charts: Grouping must be applied to display the report in the form of a chart:
- Line Chart / Area Chart / Column Chart: display “Grouping by” parameter on X axes, selected “Metrics” parameter on Y
- Bar Chart: displays “Grouping” parameter on the Y axes, selected “Metrics” on the X axes
Pie Chart: displays the percentage (“Grouping” parameter vs selected “Metrics”)
Notes:
- only one “Metrics” parameter is supported (Count of events / Cost of events / Talk time of events)
- charts do not support Grouping by “Between Users” / “Between Groups”
- to display the numeric values, click “Chart Labels” button
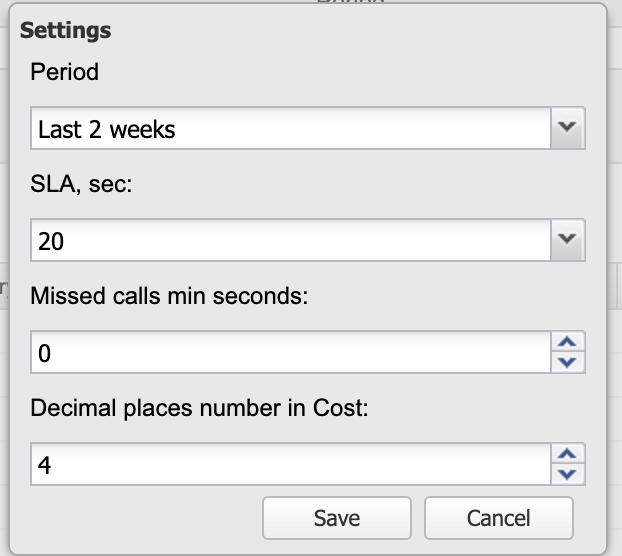
Settings / Sync
- Update: sync the last events
Settings: select the sync Period (once applied, sync is performed) / set up the SLA / set up the number of ring time in seconds to consider call as missed call/ select how many decimal places have to be displayed in Cost