On this page, you can find detailed description of the x-hoppers: Agents Stats Liveboard in x-bees which provides information about x-hoppers usage – both agents and stores statistics.
Created: December 2023
Permalink: https://wildix.atlassian.net/wiki/x/AYBkEw
Introduction
"x-hoppers: Agents Stats" Liveboard in x-bees allows you to monitor x-hoppers usage, e.g. how long agents in different stores were connected to the conference, etc.
Requirements
- WMS 6.04 or higher
- License: SuperHopper+AI
How to access x-hoppers Agents Stats
To access x-hoppers Agent Stats report:
- Go to Analytics -> on the Home or the Liveboards tab, select x-hoppers: Agent Stats:

View x-hoppers Analytics
Agents report
In the Agents section, you can find the data about how long each agent was in the conference, when agent joined the conference, how long was the talk time, etc.
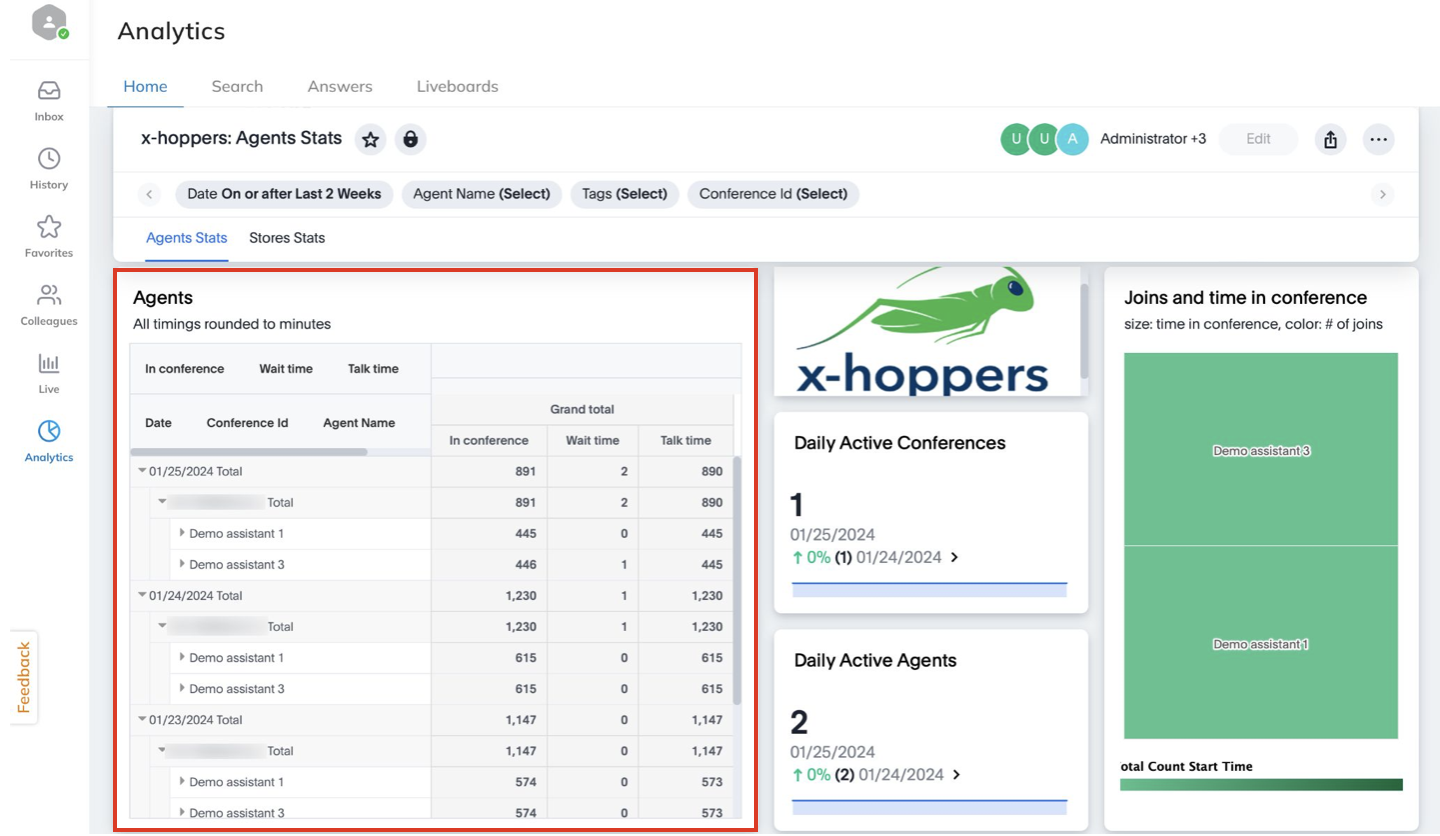
The following data is available:
- Time in conference: the total time spent in conference, which includes both wait and talk time, rounded to minutes
- Wait time: time in conference when agent(s) put the conference on hold (e.g. to participate in a call)
- Talk time: time when agent was talking
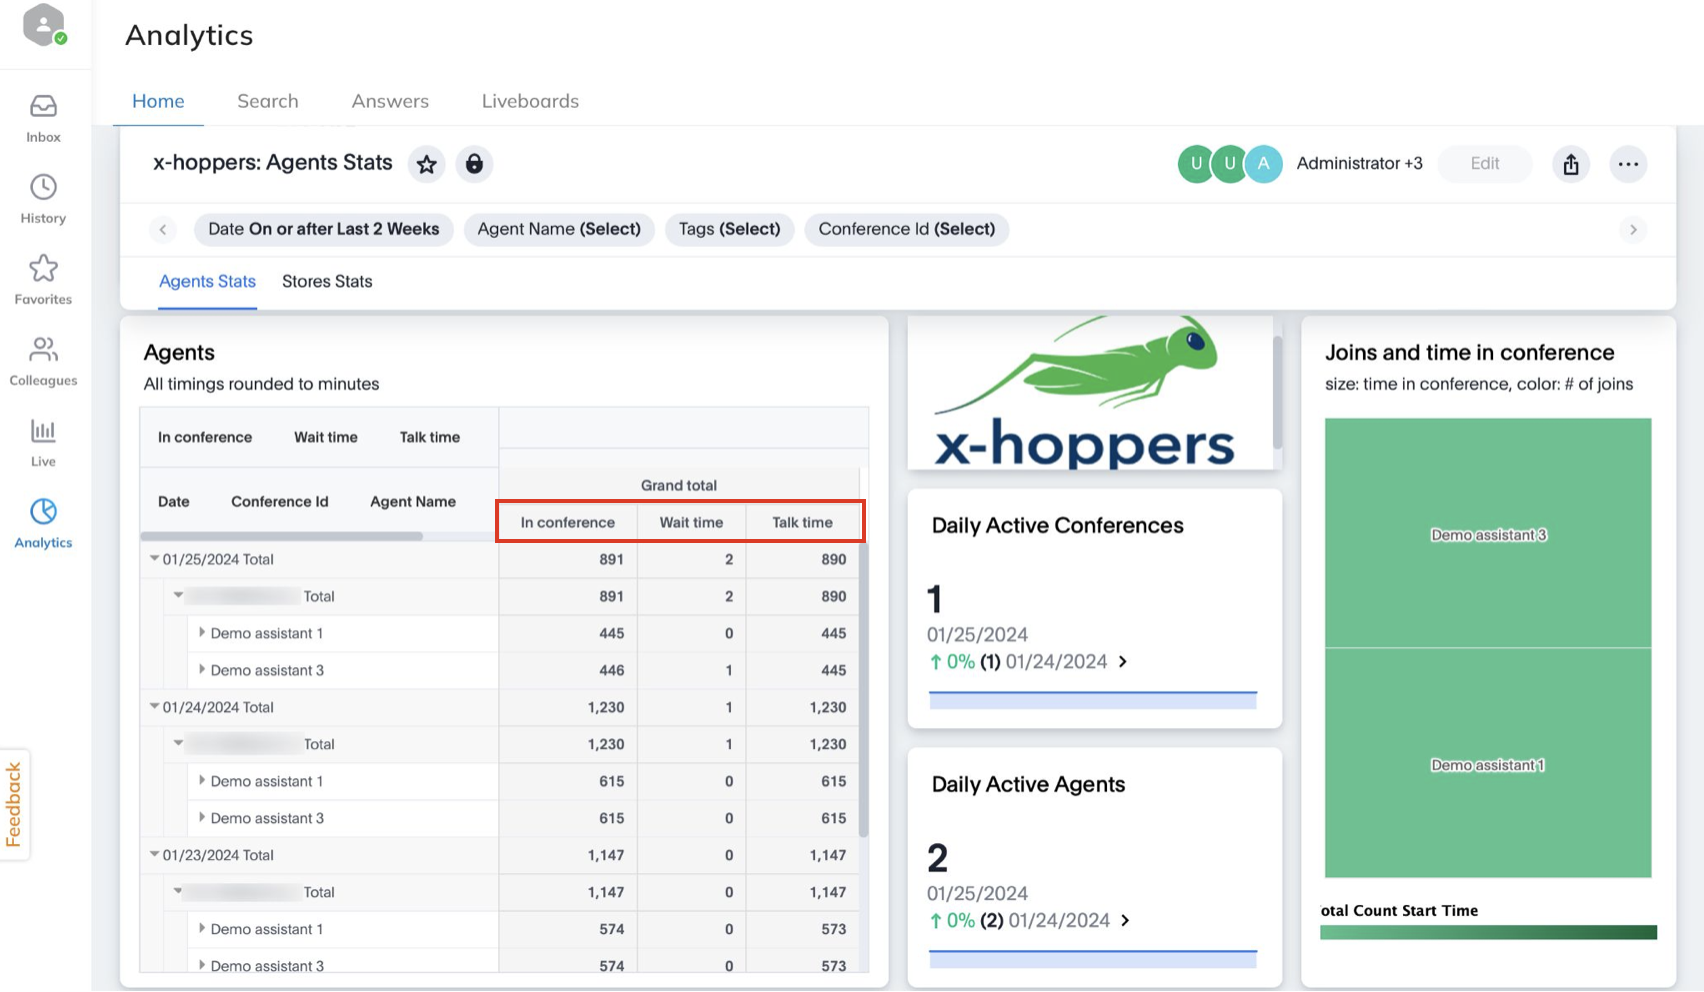
- Date (1): the date for which the statistics is gathered
- Conference ID (2): includes PBX serial and the number of the conference/ store number
- Agent name (3): name of the agent that participate in the conferences

When you click on an agent, you can see how many times the agent joined the conference within the date and at what time:

By default, the data is grouped by date. If you want to group the data e.g. by conference ID, change the order of the columns by drag and dropping the Conference ID column to the left:

Daily Active Conferences
To the right of the Agents section, you can find Daily Active Conferences block which displays the number of active conferences daily:

Daily Active Agents
Under Daily Active Conferences, you can find Daily Active Agents block, which displays the number of active agents daily for the whole company:

Joins and time in conference
In the Joins and time in conference section you can find visualization, displaying agents who spent more time in conference (agent names on bigger rectangles) and who had the biggest number of joins into the conference (rectangles with colored dark green):

Filter data
Using the panel at the top, you can assign tags for different conferences and filter report data by:
Time range
Note: The default time range is 2 weeks.
- Agent name
- Conference ID

View Stores Stats
It is also possible to view statistics per each separate store, see the least and most active stores etc. To switch to the stats per store, click on the Stores Stats tab:

The report displays the number of active users, average and total talk time per store on different dates:
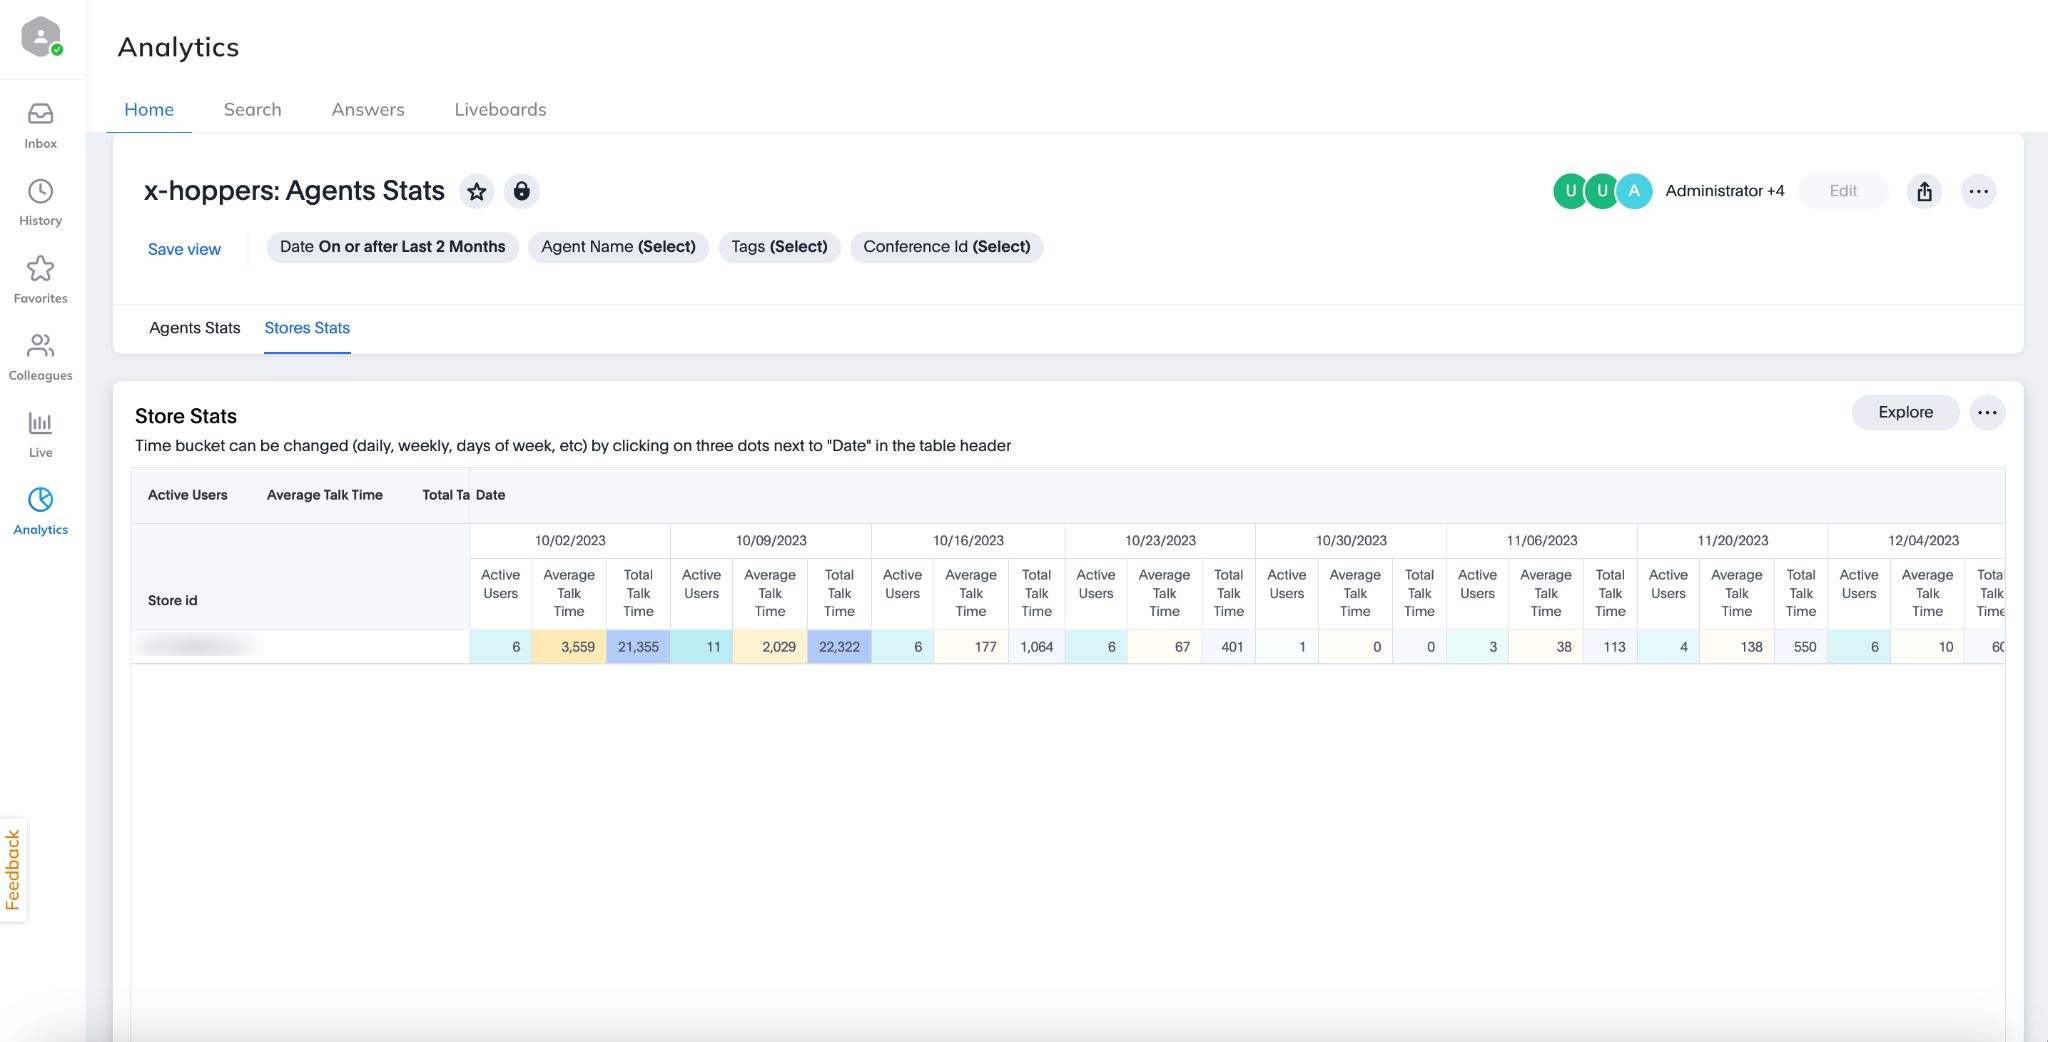
To switch to a different display of data (e.g. daily, weekly, monthly, etc.), click on the three dots next to the Date header (1) and choose the preferred parameter (2):
