| Html |
|---|
<div id="fb-root"></div>
<script>(function(d, s, id) {
  var js, fjs = d.getElementsByTagName(s)[0];
  if (d.getElementById(id)) return;
  js = d.createElement(s); js.id = id;
  js.src = 'https://connect.facebook.net/en_US/sdk.js#xfbml=1&version=v2.11';
  fjs.parentNode.insertBefore(js, fjs);
}(document, 'script', 'facebook-jssdk'));</script> |
| Html |
|---|
<div class="fb-like" data-href="https://confluence.wildix.com/x/xQKIAQ" data-layout="button_count" data-action="recommend" data-size="large" data-show-faces="true" data-share="true"></div> |
...
| Scroll export button | ||||||||
|---|---|---|---|---|---|---|---|---|
|
| Info |
|---|
The Guide explains how to set up and use Zabbix for monitoring Wildix PBX.Supported WMS version: starting from 3.82.33693 Updated: June 2018May 2023 Permalink: https://confluencewildix.wildixatlassian.comnet/wiki/x/xQKIAQmRDOAQ |
| Table of Contents |
|---|
| Note |
|---|
Zabbix should be installed and running on a separate server. |
Step 1. Setup of zabbix-agent
1. Access PBX via SSH as root:
...
3. Restart zabbix-agent:
Use the command:
On systems with WMS 6 version:
Code Block systemctl restart zabbix-agent.serviceOn systems with WMS 5 version:
Code Block /etc/init.d/zabbix-agent restart
Step 2. Setup of zabbix-server
Download the template file from https://files.wildix.com/
...
...
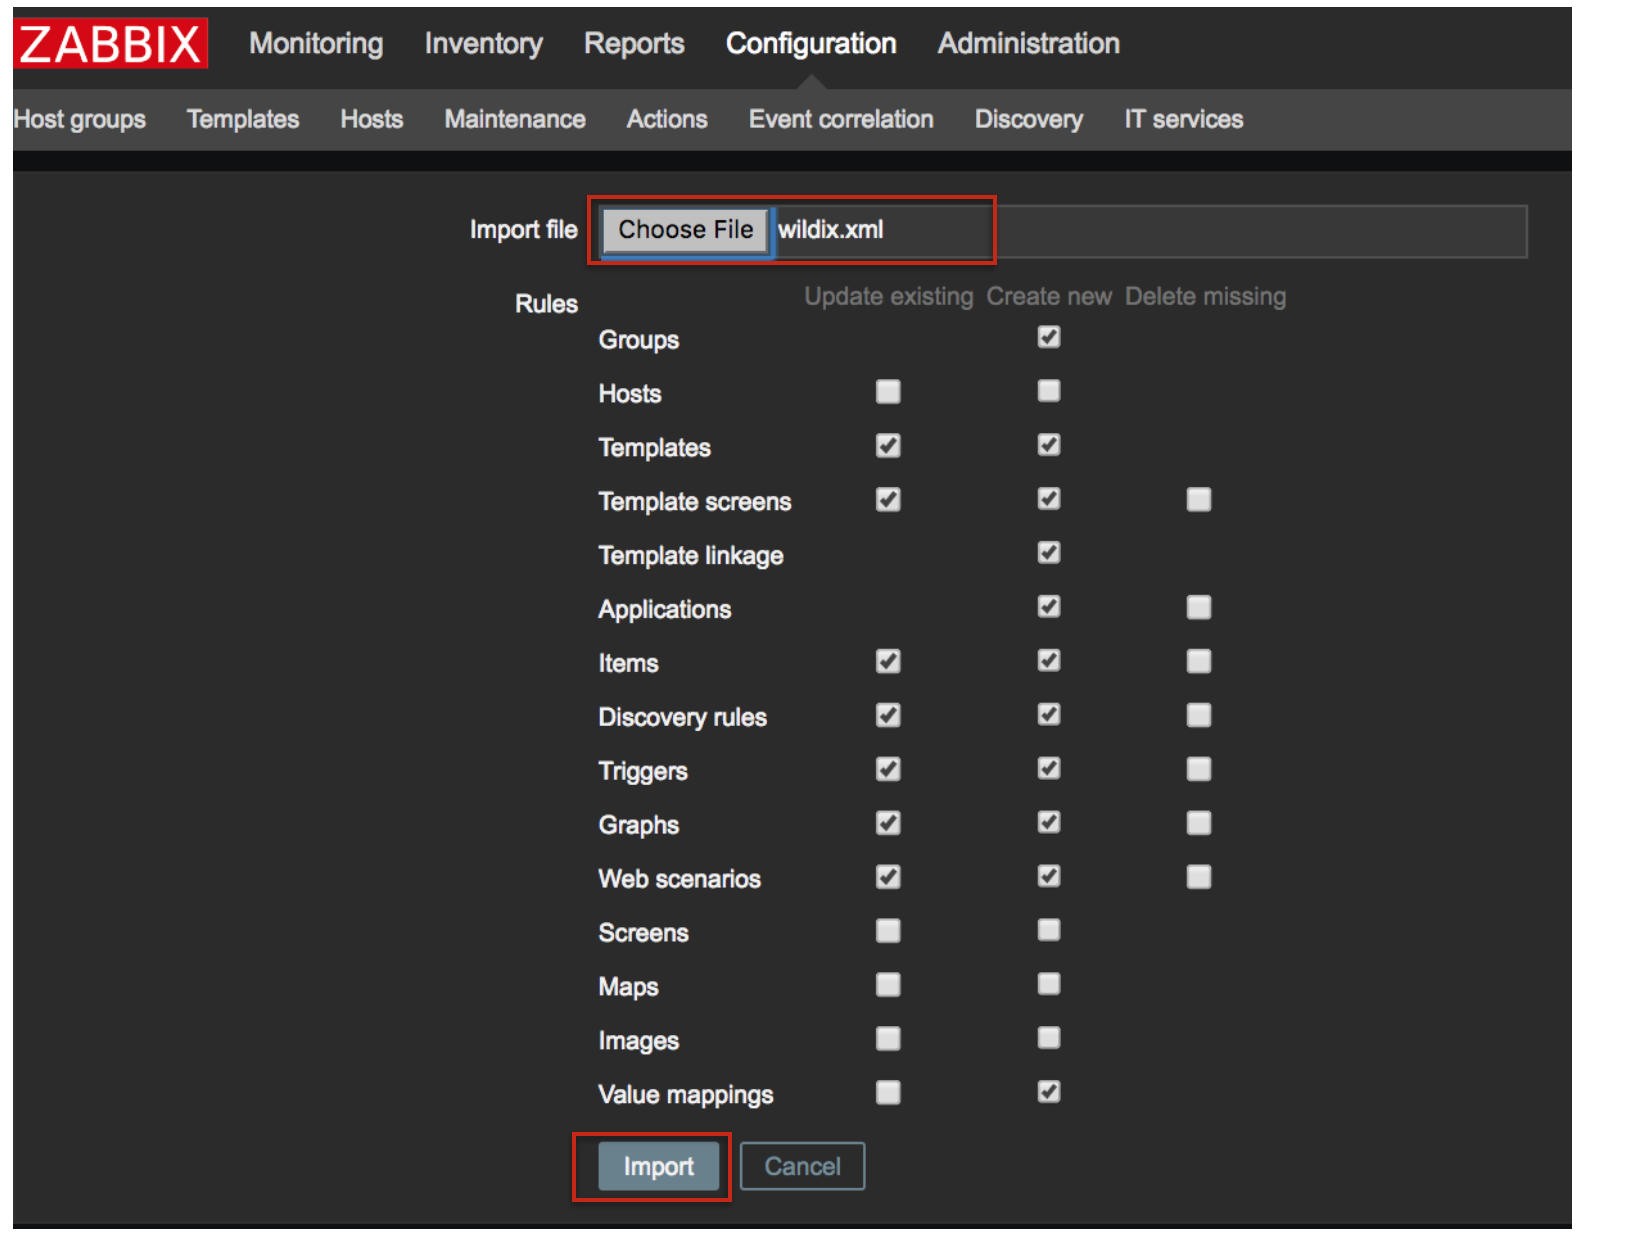
- Access Zabbix -> Configuration -> Templates,
Click Choose File to upload the template file that you have saved on your PC, then click Import
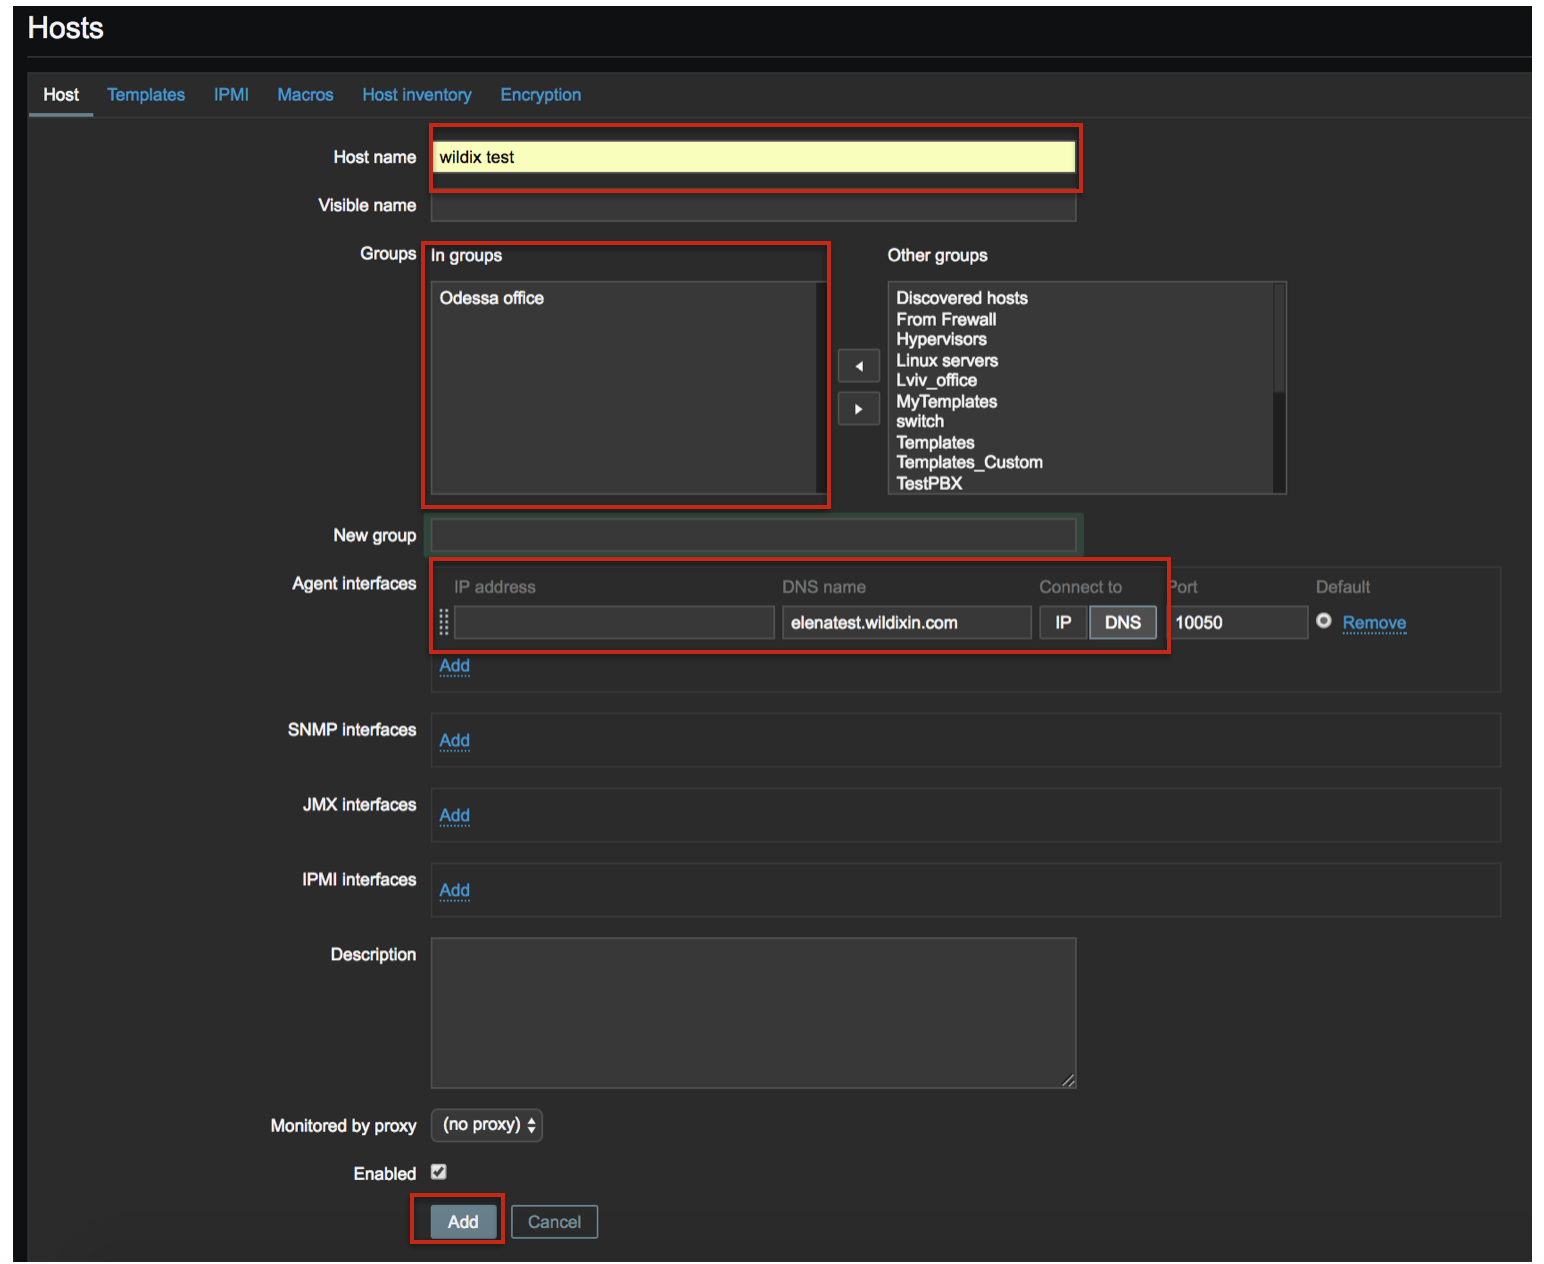
- Go to Configuration -> Hosts
- Click Create host and fill in:
- Host name
- GroupsGroups: select group(s) from “Other groups” “Other groups” section and move the selected group(s) to “In groups” “In groups” section
- Agent interfaces: enter IP address or DNS name of your Wildix PBX (depending on what you selected, choose Connect to IP or DNS
Click Add
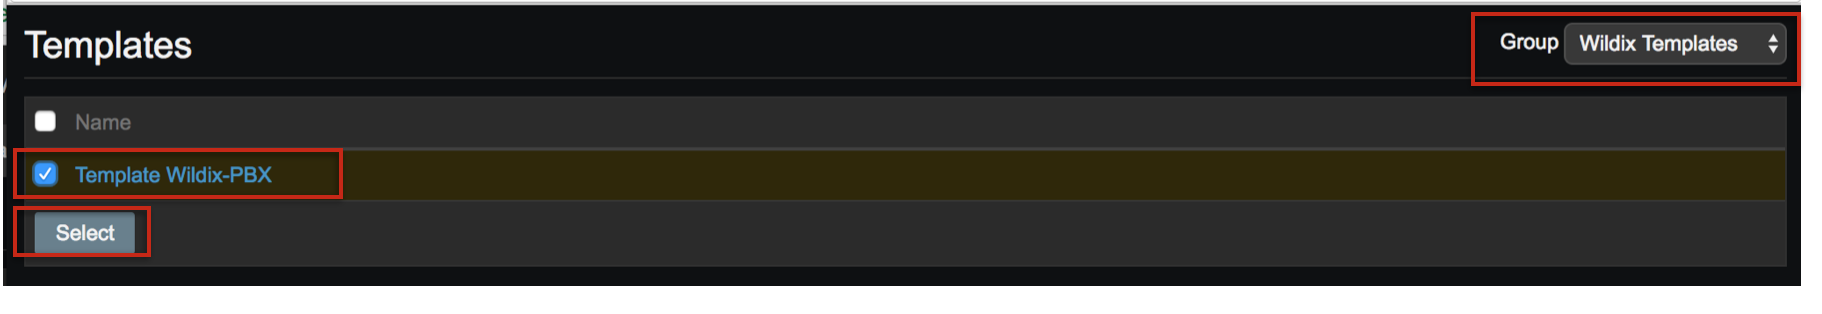
- Go to Hosts Configuration -> Templates,
- Click Select and select “Wildix Templates” Group and select “Wildix Templates” from the list
Tick off “Template “Template Wildix-PBX” PBX” and click Select
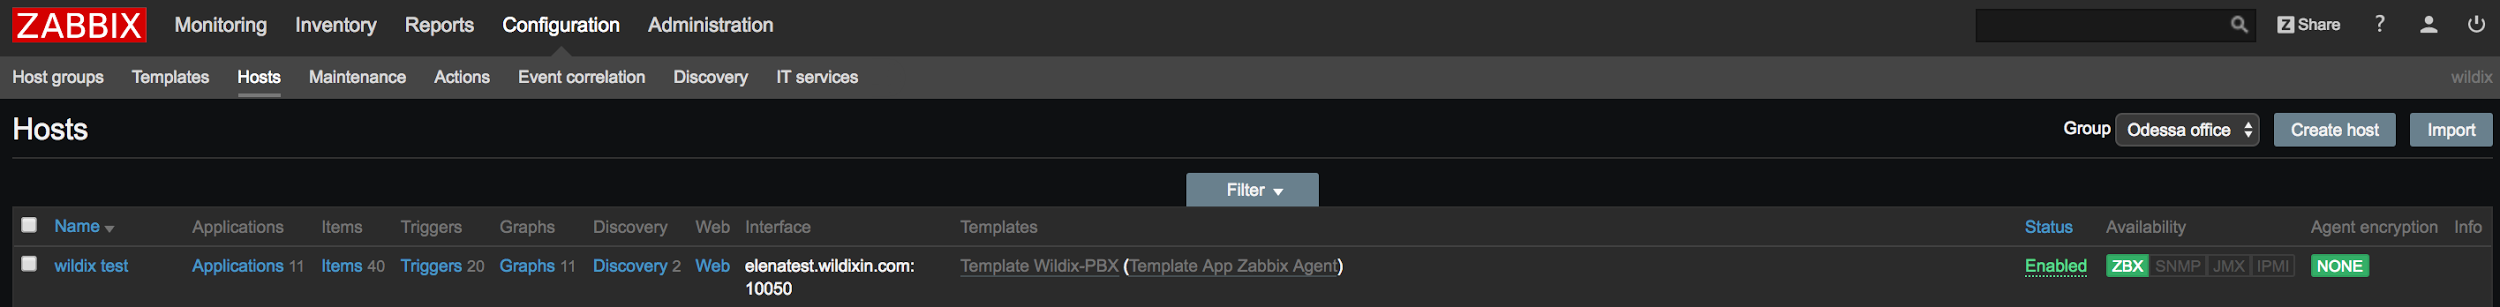
- Go to Configuration -> Hosts and find your Host on the list by its Host name
...
ZBX: green (it might take some time for ZBX icon to turn green)
Ports used by Zabbix
- 8099 TCP for pbxstat.wildix.comIP 52.18.154.170
- 10050 TCP for local Zabbix
...
| Code Block |
|---|
/etc/zabbix/zabbix_agentd.conf |
Monitoring tools
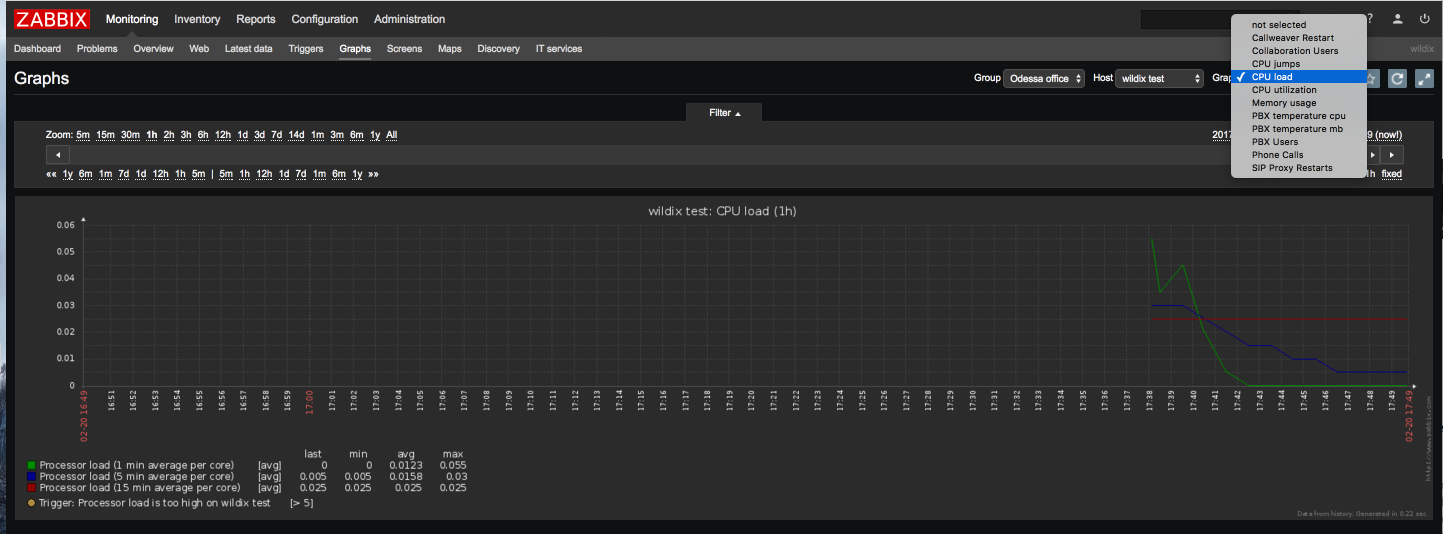
- Go to Monitoring -> Graphs
- Select your Host in the upper right section
- Select the Graph from the list of available graphs:
- Callweaver Restart
- Collaboration Users
- CPU jumps
- CPU load
- CPU utilization
- Disc space usage*
- Memory usage
- Network traffic*
- PBX temperature cpu
- PBX temperature mb
- PBX users
- Phone calls
- SIP Proxy Restarts
*these sensors become available after some time (it is necessary to update the web page)
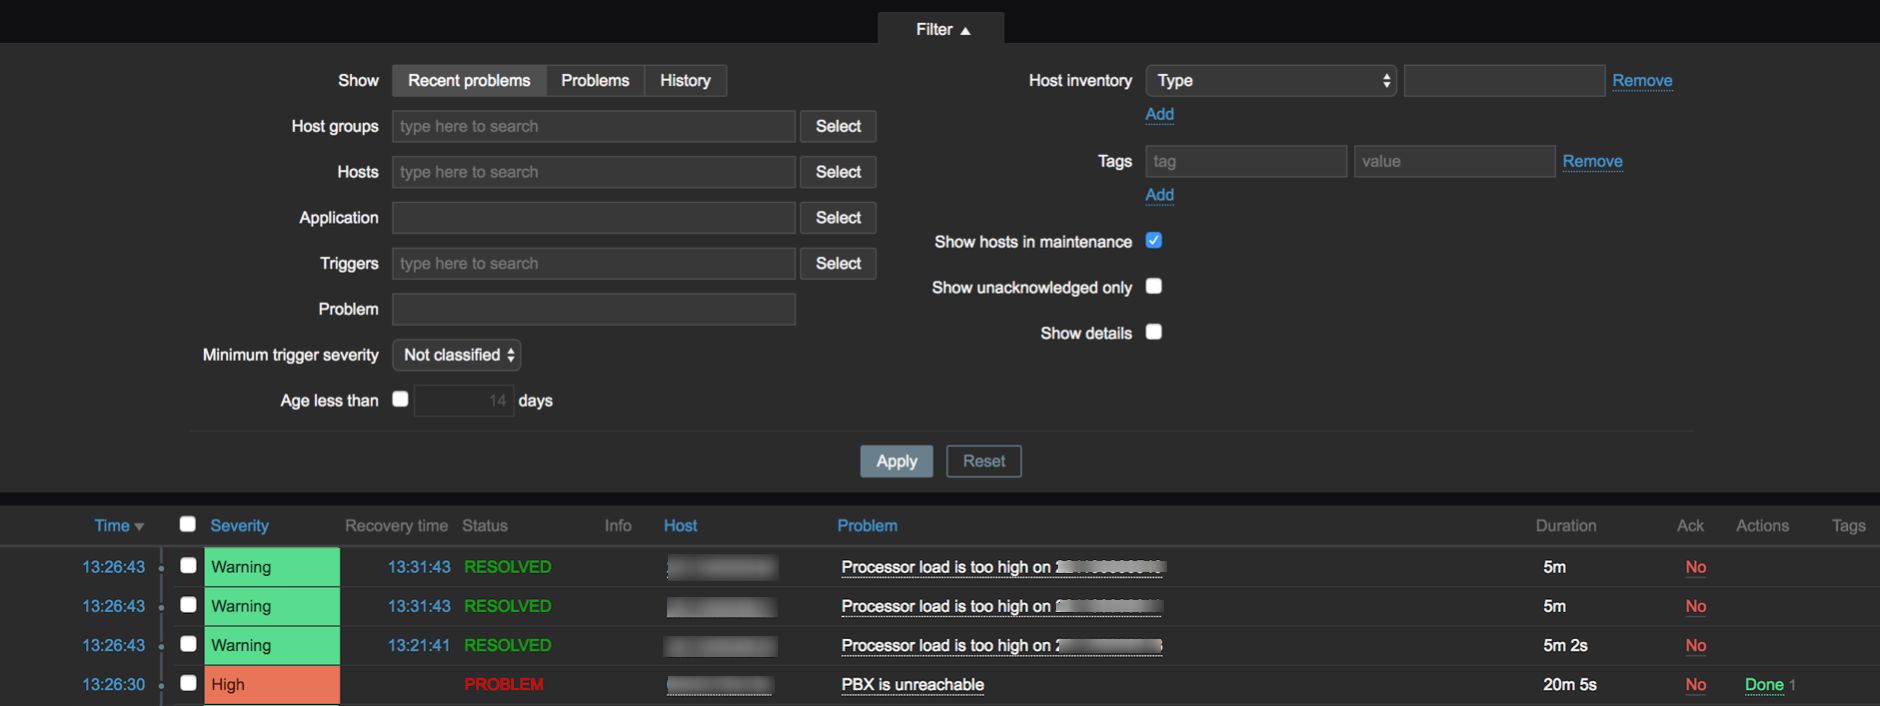
Monitoring problems
- Go to Monitoring -> Problems. Here you can see what issues you currently have with PBX. Issues are those triggers that are in the “Problem” column. When a trigger is detected, a new problem notification appears in the list. Refer to this chapter to see what each column means
- Select Find your Host from in the list of all current problems or . You can use Filter to find your Hostit:
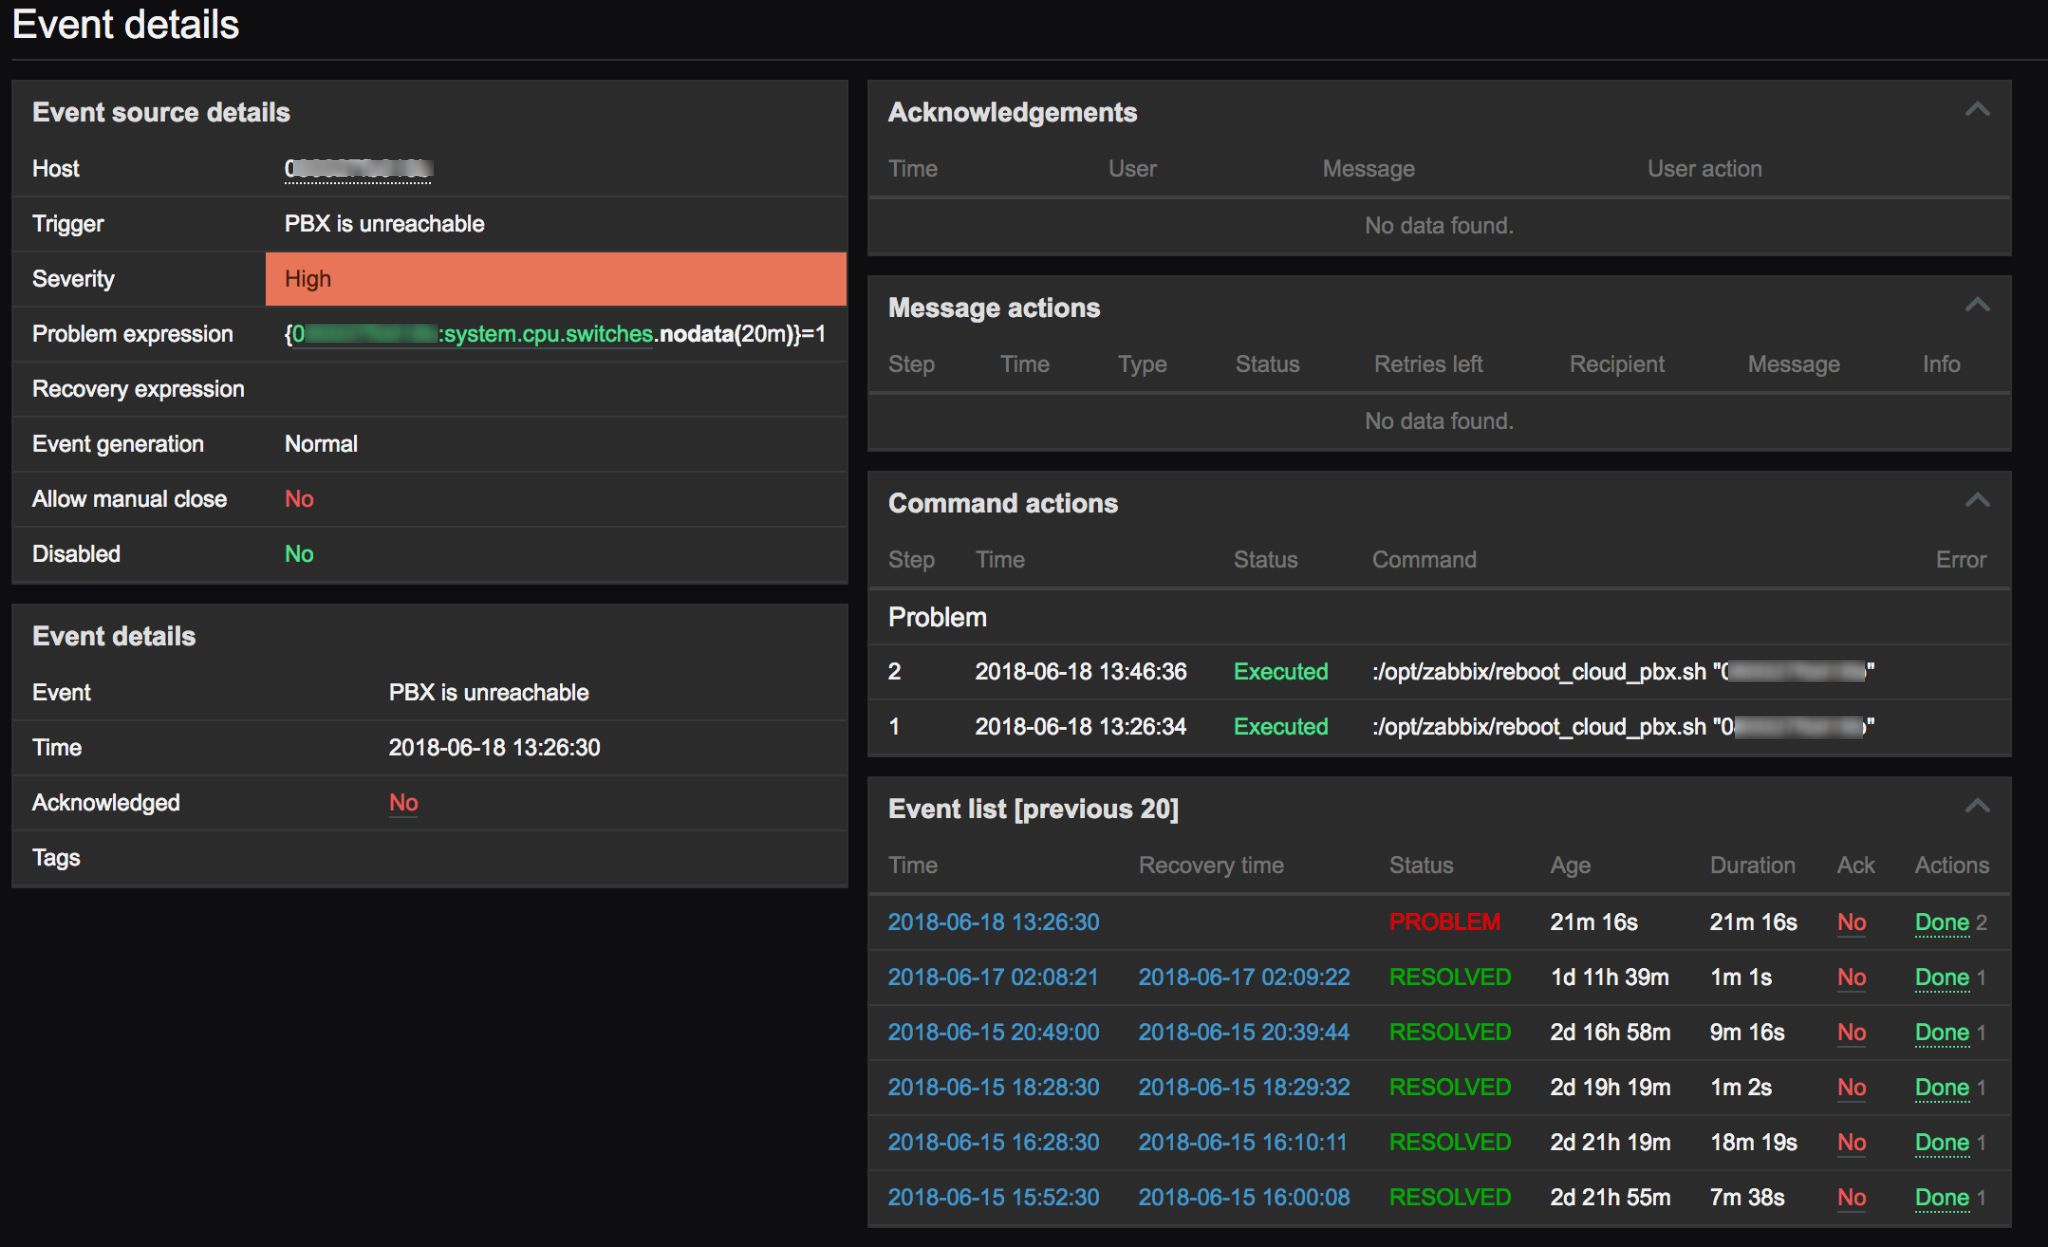
Click on the Time to open problem details:

- Details about the problem (Event details), its source, acknowledgements, actions taken (messages, remote commands) and previous similar problems are displayed:
| Note |
|---|
Note: You can also monitor look over the current problems in Monitoring -> Dashboard -> Last 20 issues: only last 20 problems are displayed here. |
Columns' description
| Column | Description |
|---|---|
| Time | Problem start time is displayed. |
| Severity | Problem severity is displayed. Problem severity is based on the severity of the underlying problem trigger. |
| Recovery time | Problem resolution time is displayed |
| Status | Problem status is displayed: |
| Info | An green information icon is displayed if a problem is closed by global correlation or manually by acknowledgement. Rolling a mouse over the icon will display more details: |
| Host | Problem host is displayed. |
| Problem | Problem name is displayed. Problem name is based on the name of the underlying problem trigger. |
| Duration | Problem duration is displayed. |
| Ack | The acknowledgement status of the problem is displayed: Yes - green text indicating that the problem is acknowledged. A problem is considered to be acknowledged if all events for it are acknowledged. No - a red link indicating unacknowledged events. If you click on the link you will be taken to a bulk acknowledgement screen where all problems for this trigger can be acknowledged at once. This column is displayed if problem acknowledgement is activated in Administration -> General. |
| Actions | Action status is displayed: In progress - action is being taken Done - action is completed Failures - action has failed The number of actions taken on the problem (such as notifications sent or executed remote commands) is also displayed. |
| Tags | Event tags are displayed (if any). |
...
| Macrosuite divider macro | ||||||||||||||||||||||||||
|---|---|---|---|---|---|---|---|---|---|---|---|---|---|---|---|---|---|---|---|---|---|---|---|---|---|---|
|
| Button macro | ||||||||||||||||||||||||||||||||||||||||
|---|---|---|---|---|---|---|---|---|---|---|---|---|---|---|---|---|---|---|---|---|---|---|---|---|---|---|---|---|---|---|---|---|---|---|---|---|---|---|---|---|
|