| Html |
|---|
<div id="fb-root"></div>
<script>(function(d, s, id) {
  var js, fjs = d.getElementsByTagName(s)[0];
  if (d.getElementById(id)) return;
  js = d.createElement(s); js.id = id;
  js.src = 'https://connect.facebook.net/en_US/sdk.js#xfbml=1&version=v2.11';
  fjs.parentNode.insertBefore(js, fjs);
}(document, 'script', 'facebook-jssdk'));</script> |
...
| Info |
|---|
On this page, you can find documentation about x-bees Snalytics which provides all the information you need to keep on top of your business. Created: May 2022 Permalink: https://confluence.wildix.com/x/BYL6Bg |
| Html |
|---|
<div class="fb-like" data-href="#" data-layout="button_count" data-action="recommend" data-size="large" data-show-faces="true" data-share="true"></div> |
...
Hovering a mouse over any of these items, you can see a tooltip with the following info: name, description, data source (if applicable), and data type.:
Start a new search
Click Search on the top navigation bar.
Start typing your search request, using necessary data items and keywords.
Alternatively, you can double-click on the preferred data items on the left-side panel and they are automatically added to the Search field. To add multiple items, you can click on the necessary items to select them and press + Add Columns:Note Note: Typing in your search query, you may notice that search items are of different colours:
- blue = attributes: primarily text or date values. Usually, attributes make up the x-axis of your chart. Examples: caller name, call status, etc.
- green = measures: numeric values, e.g. duration of a call
- grey = filters, e.g. outbound, inbound
3. Once your search query is ready, press Enter on keyboard, or click Go to the right of the search bar:
...
Change display of a search result
Switch between table/ chart view
You can change the view of your answer so it appears as either a table or a chart. To change the view of your answer, toggle between either a table or a chart type:
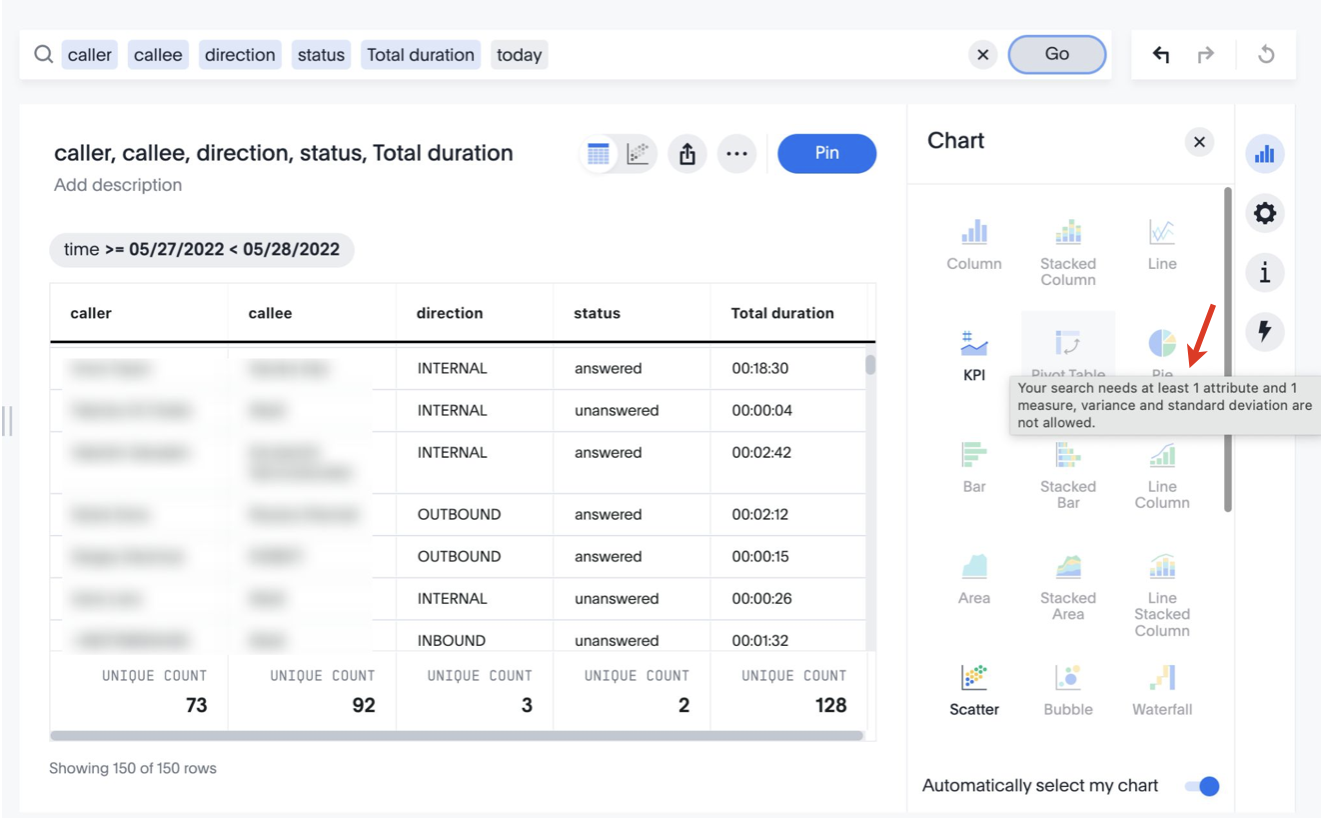
Your search needs at least one attribute and one measure to be presented as a chart. When you display your data as a chart, x-bees automatically selects the type of chart that works best for your data. If you want to use another type, click Change visualization (chart icon) on the right:
You can choose from a large number of chart types, each providing a different visualization for your answer. Select the type of chart you want:
See detailed information about chart item
In
| Note | ||
|---|---|---|
Notes:
|
See detailed information about chart item
In the example on the screenshot above, we searched for unanswered incoming calls this month by service and chose the data to be displayed in a stacked column chart.
If, say, you need a more detailed information regarding any of the service/ group displayed in the chart, right-click on the necessary item on visualization (1) -> choose Drill down (2):
In the Drill down pop-up screen, choose the data you want to explore:
...
To add an answer to Liveboards tab, which contains a collection of answers in a pinboard (dashboards) view, click Pin:
Answers
The Answers tab allows to view and modify saved search results as individual answers. Here are displayed both your answers and answers shared with you by other users. Answers are the saved results of a search. On the Answers tab, you can see the answers you saved, as well as answers of other users, in case these people shared them with you or a group you belong to.
If you tick the checkbox next to an answer, the following buttons appear above the answers list:
...
Click on the necessary Liveboard to see its details:
Keyword reference
Use keywords to help define a search.
General
| Note |
|---|
Note: When using the top or bottom keywords without specifying a number (n), the number defaults to |
| Keyword | Description |
|---|---|
| top n | Generates the top n items from a sorted result. Examples: top 10 sales rep revenue top sales rep by count sales for average revenue > 10000 sales rep average revenue for each region top |
| top n measure1 by attribute|measure2 | Calculates top n items, then sorts the top items by another measure or attribute. Contrast with top n (swaps the order of operations). Example: top 10 sales rep revenue by profit margin |
| bottom n | Generates the bottom n items from a sorted result. Examples: bottom 25 customer by revenue for each sales rep bottom revenue average bottom revenue by state customer by revenue for each sales rep bottom |
| sort by | Sorts the result set by an attribute or measure. Examples: revenue by state sort by average revenue descending revenue by customer sort by region sort by state |
| by <measure> | Treats the measure as an attribute and groups the result set by it. Examples: conversations by day |
Date
| Keyword | Examples |
|---|---|
| after | order date after 10/31/2014 |
| before | order date before 03/01/2014 |
between ... and ... | order date between 01/30/2012 and 01/30/2014 |
| daily | shipments by region daily |
| daily year-over-year | growth of revenue by order date daily year-over-year |
| day | count monday restaurant |
day of week | revenue by day of week last 6 months |
| growth of … by ... | growth of sales by order date |
| growth of … by … daily | growth of sales by order date daily |
| growth of … by … monthly | growth of sales by date shipped monthly sales > 24000 |
| growth of … by … quarterly | growth of sales by date shipped quarterly |
| growth of … by … weekly | growth of sales by receipt date weekly for pro-ski2000 |
| hourly | visitors by page name hourly |
| last day by | customers last day by referrer |
| last month | customers last month by store |
last month by | customers last month by day |
| last n days | visitors last 7 days |
| last n months | visitors last 10 months by day |
| last n quarters | visitors last 2 quarters by month by campaign |
| last n weeks | visitors last 10 weeks by day |
| last n years | visitors last 5 years by revenue for sum revenue > 5000 |
last quarter | customers last quarter sale > 300 |
| last week | customers last week by store |
| last year | top 10 customers last year by sale by store for region west |
| month | revenue by month last year |
| month | commission January |
| month to date | sales by product month to date sales > 2400 |
month year | commission by sales rep February 2014 |
| monthly | commission > 10000 monthly |
| monthly year-over-year | growth of revenue by receipt date monthly year-over-year |
| n days ago | sales 2 days ago |
| last n days for each month | sales last 2 days for each month |
| last n days for each quarter | revenue last 15 days for each quarter |
| last n days for each week | total sold last 2 days for each week |
| last n days for each year | revenue last 300 days for each year |
| last n hours for each day | sales last 2 hours for each day |
| n months | visitors last 6 months for homepage visits > 30 by month |
| n months ago | sales 2 months ago by region |
last n months for each quarter | cost last 2 months for each quarter |
| last n months for each year | last 8 months for each year |
| n quarters ago | sales 4 quarters ago by product name contains deluxe |
| last n quarters for each year | last 2 quarters for each year |
| n weeks ago | sales 4 weeks ago by store |
| last n weeks for each month | sales last 3 weeks for each month |
| last n weeks for each quarter | last 2 weeks for each quarter |
| last n weeks for each year | last 3 weeks for each year |
| n years | opportunities next 5 years by revenue |
| n years ago | sales 5 years ago by store for region west |
| next day | shipments next day by order |
| next month | appointments next month by day |
| next n days | shipments next 7 days |
| next n months | openings next 6 months location |
| next n quarters | opportunities next 2 quarters by campaign |
next n weeks | shipments next 10 weeks by day |
| next n years | projected deals next 5 years |
| next quarter | opportunities next quarter amount > 30000 |
| next week | shipments next week by store |
| next year | opportunities next year by sales rep |
quarter to date | sales by product quarter to date for top 10 products by sales |
quarterly | sales quarterly for each product |
quarterly year-over-year | growth of revenue by date shipped quarterly year-over-year |
| this day | shipments this day by order |
this month | appointments this month by day |
| this quarter | opportunities this quarter amount > 30000 |
| this week | shipments this week by store |
| this year | opportunities this year by sales rep |
| today | sales today by store |
| week | revenue by week last quarter |
| week to date | sales by order date week to date for pro-ski200 |
| weekly | revenue weekly |
| weekly year-over-year | growth of revenue by date shipped weekly year-over-year |
| year | revenue by product 2014 product name contains snowboard |
year to date | sales by product year to date |
| yearly | shipments by product yearly |
| yesterday | sales yesterday for pro-ski200 by store |
...
Comparative
| Keyword | Examples | ||
|---|---|---|---|
| all | revenue asia vs all
| ||
| between... and... | revenue between 0 and 1000 | ||
= (equal) | unique count visitor by store purchased products = 3 for last 5 days | ||
| everything | revenue asia vs everything
| ||
| > (greater than) | sum sale amount by visitor by product for last year sale amount > 2000 | ||
>= (greater than or equal) | count calls by employee lastname >= m | ||
< (less than) | unique count visitor by product by store for sale amount < 20 | ||
<= (less than or equal) | count shipments by city latitude <= 0 | ||
!= (not equal) | sum sale amount region != canada date != last 5 days | ||
vs, versus | revenue east vs west |
...
In / Not in
| Keyword | Description |
|---|---|
| in | Query in query search (intersection of two sets). Must match last attribute before keyword with first attribute inside subsearch. Syntax: attribute in (attribute subsearch) Examples: store name in (top 10 store name by sales footwear) product name 2014 product name in (product name 2013) sales |
not in | Relative complement of two sets. Must match last attribute before keyword with first attribute inside subsearch. Syntax: attribute not in (attribute subsearch) Example: product name 2014 product name not in (product name 2013) sales |
| Note |
|---|
Note: Searches with the in keyword do not include {null} values. To include {null} values, create a formula for the relevant attribute in your search, to convert {null} values to 'unknown,' or some similar word. |
...