| Html |
|---|
<div id="fb-root"></div>
<script>(function(d, s, id) {
  var js, fjs = d.getElementsByTagName(s)[0];
  if (d.getElementById(id)) return;
  js = d.createElement(s); js.id = id;
  js.src = 'https://connect.facebook.net/en_US/sdk.js#xfbml=1&version=v2.11';
  fjs.parentNode.insertBefore(js, fjs);
}(document, 'script', 'facebook-jssdk'));</script> |
...
| Info |
|---|
On this page, you can find documentation about x-bees Snalytics which provides all the information you need to keep on top of your business. Created: May 2022 Permalink: https://confluence.wildix.com/x/BYL6Bg |
| Html |
|---|
<div class="fb-like" data-href="#" data-layout="button_count" data-action="recommend" data-size="large" data-show-faces="true" data-share="true"></div> |
...
- Search field that allows to look for necessary data. Refer to Start a new search sections of this guide for more details.
- Watchlist with personalized set of metrics you choose to monitor
- List of saved answers and liveboards, which you created or which were shared with you or with a group you belong to
- Trending Liveboards
- Trending Answers
...
Click on the Data button to the left of the search field to see the list of available data items:
The list of data items (columns) includes the following options:
- average duration
- callee
- caller
- connect time
- conversation id
- conversations
- direction
- domain
- duration
- flags
- hangup
- name
- role
- serial
- service
- status
- subject
- tags
- talk time
- time
- total duration
- type
- wait time
...
Click Search on the top navigation bar.
Start typing your search request, using necessary data items and keywords.
Alternatively, you can double-click on the preferred data items on the left-side panel and they are automatically added to the Search field. To add multiple items, you can click on the necessary items to select them and press + Add Columns:Note Note: Typing in your search query, you may notice that search items are of different colours:
- blue = attributes: primarily text or date values. Usually, attributes make up the x-axis of your chart. Examples: caller name, call status, etc.
- green = measures: numeric values, e.g. duration of a call
- grey = filters, e.g. outbound, inbound
3. Once your search query is ready, press Enter on keyboard, or click Go to the right of the search bar:
...
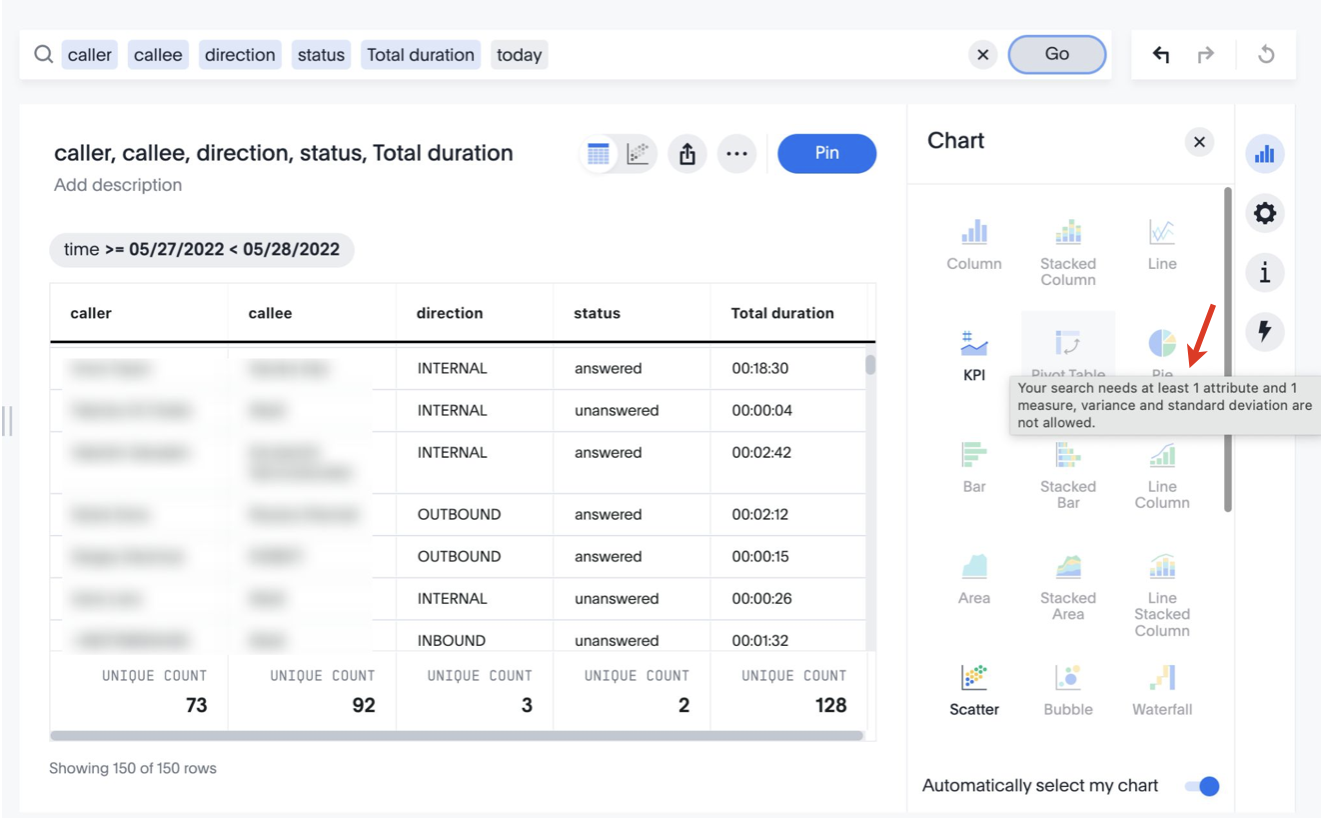
If you type in the search request "caller callee direction status duration today", the system returns a table with total duration of calls including information about caller, callee, direction of calls (inbound/ outbound), and call status:
SOME USE CASES?
E.g. abt 5 ready-to use search queries ?
Edit a search
When you click a search phrase, it is highlighted, and x-bees displays other suggestions from which you can choose to replace the highlighted phrase. If, say, you want the same data to be displayed not for today only, but for last week, for example, click on the "today" filter in the search field and choose the preferred option:
...
You can insert a new phrase in the middle of a search, by clicking between phrases and entering the new phrase. Also, you can merge phrases without breaking the search.
Also, you can add data items to your search request by selecting relevant items on the left (1) and click Add columns (2). Once added, click Go in the Search field.

| Note |
|---|
Note: In case a table or chart doesn’t seem to contain all the data you expect, try looking in the search bar for filters in gray boxes. Remove unnecessary filters, you get all available data for that search. |
Change display of an answer
View query details
To view details of the query, click on the Query details button (info icon) on the right:

Change display of an answer
Switch between table/ chart view
...
| Note | ||
|---|---|---|
Notes:
|
...
| Note |
|---|
Note: For detailed information about charts, refer to the Chart types section of this guide. |
...
Drill down chart item
In the example on the screenshot above, we searched for unanswered incoming calls this month by service and chose the data to be displayed in a stacked column chart.
...
3. Choose an existing liveboard or create a new one
4. Click Pin:
- last item on the right panel -custom actions
- formulas?
Answers
Answers are the saved results of a search. On the Answers tab, you can see the answers you saved, as well as answers of other users, in case they shared them with you or a group you belong to.
...
Clicking on an answer, it opens in a table/ chart view with the same editing options described in the x-bees Statistics section of this guide:
Liveboards
Liveboards act like dashboards. They are collections of related charts and tables, that you monitor most often. On the Liveboards tab, you can see the liveboards you saved, as well as liveboards of other users, in case they shared them with you or a group you belong to:Click on the necessary liveboard from the list to see its details: group you belong to:
View a Liveboard
Click on the necessary Liveboard from the list to see its details:
| Note |
|---|
Note: The data is updated every ____ ?_____ |
You can perform the following actions with a Liveboard:
- Clicking on the Star icon next to Liveboard name, you can add it to favorites.
- Lock icon indicates whether you have view only or edit access to the Liveboard.
- Schedule button allows to
- If you want to share the Liveboard with a user or group, click Share icon.
- Clicking More (three dots) button (1), you get access to the following options (2):
- Make a copy
- Add filters
- Configure filters
- Copy link
- Present
- Manage schedules
- Export TML
- Update from TML (edit access required)
- Edit TML (edit access required)
- Liveboard info

- How to organize items on Liveboard? / change order of items
Add visualizations
In case you’ve created a Liveboard, but there are not answers yet, click Add visualizations:
...
The answer opens and besides viewing its details. Also, using the Explore this data panel on the right, you can modify the answer by applying additional filters, adding/ replacing columns, choose data for comparison:
Explore data - answer is not saved?
Edit answer - answer is not saved automatically - should pin?
Keyword reference
Use keywords Keywords help to help define a search.
General
| Note |
|---|
Note: When using the top or bottom keywords without specifying a number (n), the number defaults to |
| Keyword | Description |
|---|---|
| top n | Generates the top n items from a sorted result. Example: caller callee direction status duration today top 5 |
| top n measure1 by attribute|measure2 | Calculates top n items, then sorts the top items by another measure or attribute. Contrast with top n (swaps the order of operations). Example: top 10 caller by conversations this month |
| bottom n | Generates the bottom n items from a sorted result. Example: bottom 10 caller by conversations this month |
| sort by | Sorts the result set by an attribute or measure. Example: caller callee direction status duration today sort by duration |
| by <measure> | Treats the measure as an attribute and groups the result set by it. Example: conversations by day |
Date
| Keyword | Examples |
|---|---|
| after | conversations after 10/31/2022 |
| before | conversations before 03/01/2022 |
between ... and ... | conversations between 01/30/2022 and 01/30/2022 |
| day | conversations monday |
day of week | conversations by day of week last 3 months |
| growth of … by ... | growth of conversations by time last month unanswered |
| growth of … by … daily | growth of conversations by time daily last month unanswered |
| growth of … by … monthly | growth of conversations by time monthly unanswered |
| growth of … by … quarterly | growth of conversations by time quarterly unanswered |
| growth of … by … weekly | growth of conversations by time weekly last month unanswered |
| last day by | conversations last day by callee |
| last month | conversations last month by callee |
last month by | conversations last month by day |
| last n days | conversations last 7 days |
| last n months | conversations last 10 months by day |
| last n quarters | conversations last 2 quarters by month by service |
| last n weeks | conversations last 10 weeks by day |
last quarter | conversations last quarter |
| last week | conversations last week by service |
| last year | conversations last year by callee |
| month | conversations by month last year |
| month | conversations January |
| month to date | conversations month to date ?? |
month year | conversations by service February 2022 |
| n days ago | conversations 2 days ago |
| last n days for each month | conversations 2 days for each month |
| last n days for each quarter | conversations last 15 days for each quarter |
| last n days for each week | conversations last 2 days for each week |
| last n days for each year | conversations last 300 days for each year |
| last n hours for each day | conversations last 2 hours for each day |
| n months | conversations last 6 months |
| n months ago | conversations 2 months ago by service |
last n months for each quarter | conversations last 2 months for each quarter |
| last n months for each year | conversations last 8 months for each year |
| n quarters ago | conversations 4 quarters ago by service |
| n weeks ago | conversations 4 weeks ago by callee |
| last n weeks for each month | conversations last 3 weeks for each month |
| last n weeks for each quarter | last 2 weeks for each quarter |
quarter to date | sales by product quarter to date for top 10 products by sales |
| this day | conversations this day by callee |
this month | conversations this month by day |
| this quarter | conversations this quarter by callee |
| this week | conversations this week by service |
| this year | conversations this year by callee |
| today | conversations today by callee |
| week | conversations by week last quarter |
| week to date | sales by order date week to date for pro-ski200 |
| year | revenue by product 2014 product name contains snowboard |
year to date | sales by product year to date |
| yesterday | sales yesterday for pro-ski200 by store |
...
Comparative
| Keyword | Examples | ||
|---|---|---|---|
| all | conversations uk_support vs all
| ||
| between... and... | revenue between 0 and 1000 | ||
= (equal) | unique count visitor by store purchased products = 3 for last 5 days | ||
| everything | conversations uk_support vs everything
| ||
| > (greater than) | sum sale amount by visitor by product for last year sale amount > 2000 | ||
>= (greater than or equal) | count calls by employee lastname >= m | ||
< (less than) | unique count visitor by product by store for sale amount < 20 | ||
<= (less than or equal) | count shipments by city latitude <= 0 | ||
!= (not equal) | caller callee direction status duration today callee !={null} | ||
vs, versus | conversations uk_support vs us_support |
...
In / Not in
| Keyword | Description |
|---|---|
| in | Query in query search (intersection of two sets). Must match last attribute before keyword with first attribute inside subsearch. Syntax: attribute in (attribute subsearch) Examples: store name in (top 10 store name by sales footwear) product name 2014 product name in (product name 2013) sales |
not in | Relative complement of two sets. Must match last attribute before keyword with first attribute inside subsearch. Syntax: attribute not in (attribute subsearch) Example: product name 2014 product name not in (product name 2013) sales |
...
| Note |
|---|
Note: Searches with the in keyword do not include {null} values. To include {null} values, create a formula for the relevant attribute in your search, to convert {null} values to 'unknown,' or some similar word. |
Chart types -remove
Column charts
The column chart is one of simplest, yet most versatile chart types. The column chart is often the chosen default chart type, and displays data as vertical columns. Column charts are vertical bar charts that display your data using rectangular bars. The length of the bar is proportional to the data value.
...