On this page, you can find detailed description of the Cloud Analytics (CDR-View 2.0) feature in Collaboration which provides all the information you need to keep on top of your business.
Created: July 2023
Permalink: https://wildix.atlassian.net/wiki/x/AYBJDQ
Introduction
Same as CDR-View, Analytics tab in Collaboration allows to monitor the call activity of the employees and get reports related to the number of calls, costs, call duration, usage of trunks, etc, as well as analyze the activity of call agents and response groups.
Requirements
WMS Beta 6.03.20230630.3 or higher
- License: UC-Premium
- ACL rules set in WMS:
- can use analytics: adds display of the Analytics button in Collaboration
- can see analytics: lets to choose which groups data will be available in Analytics reports
Note: Analytics is not available if Collaboration is opened via iframe.
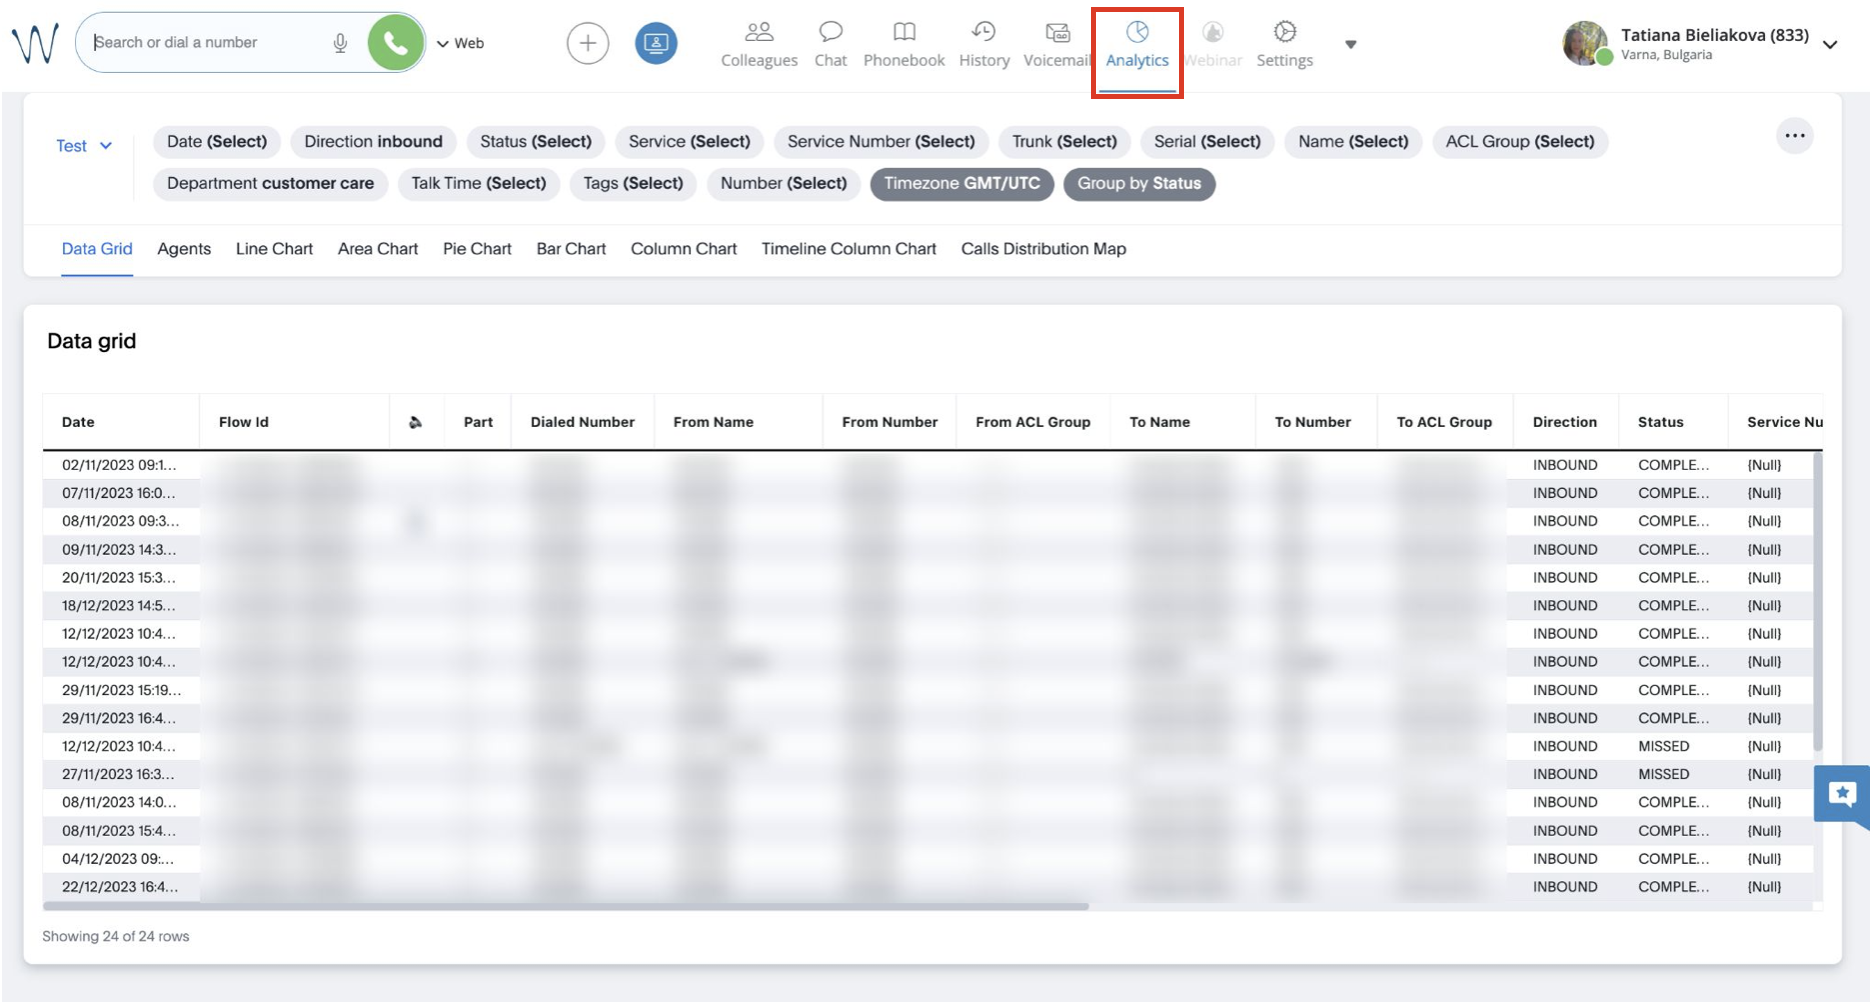
How to access Analytics
To access Analytics, click on the Analytics button at the top of the screen:
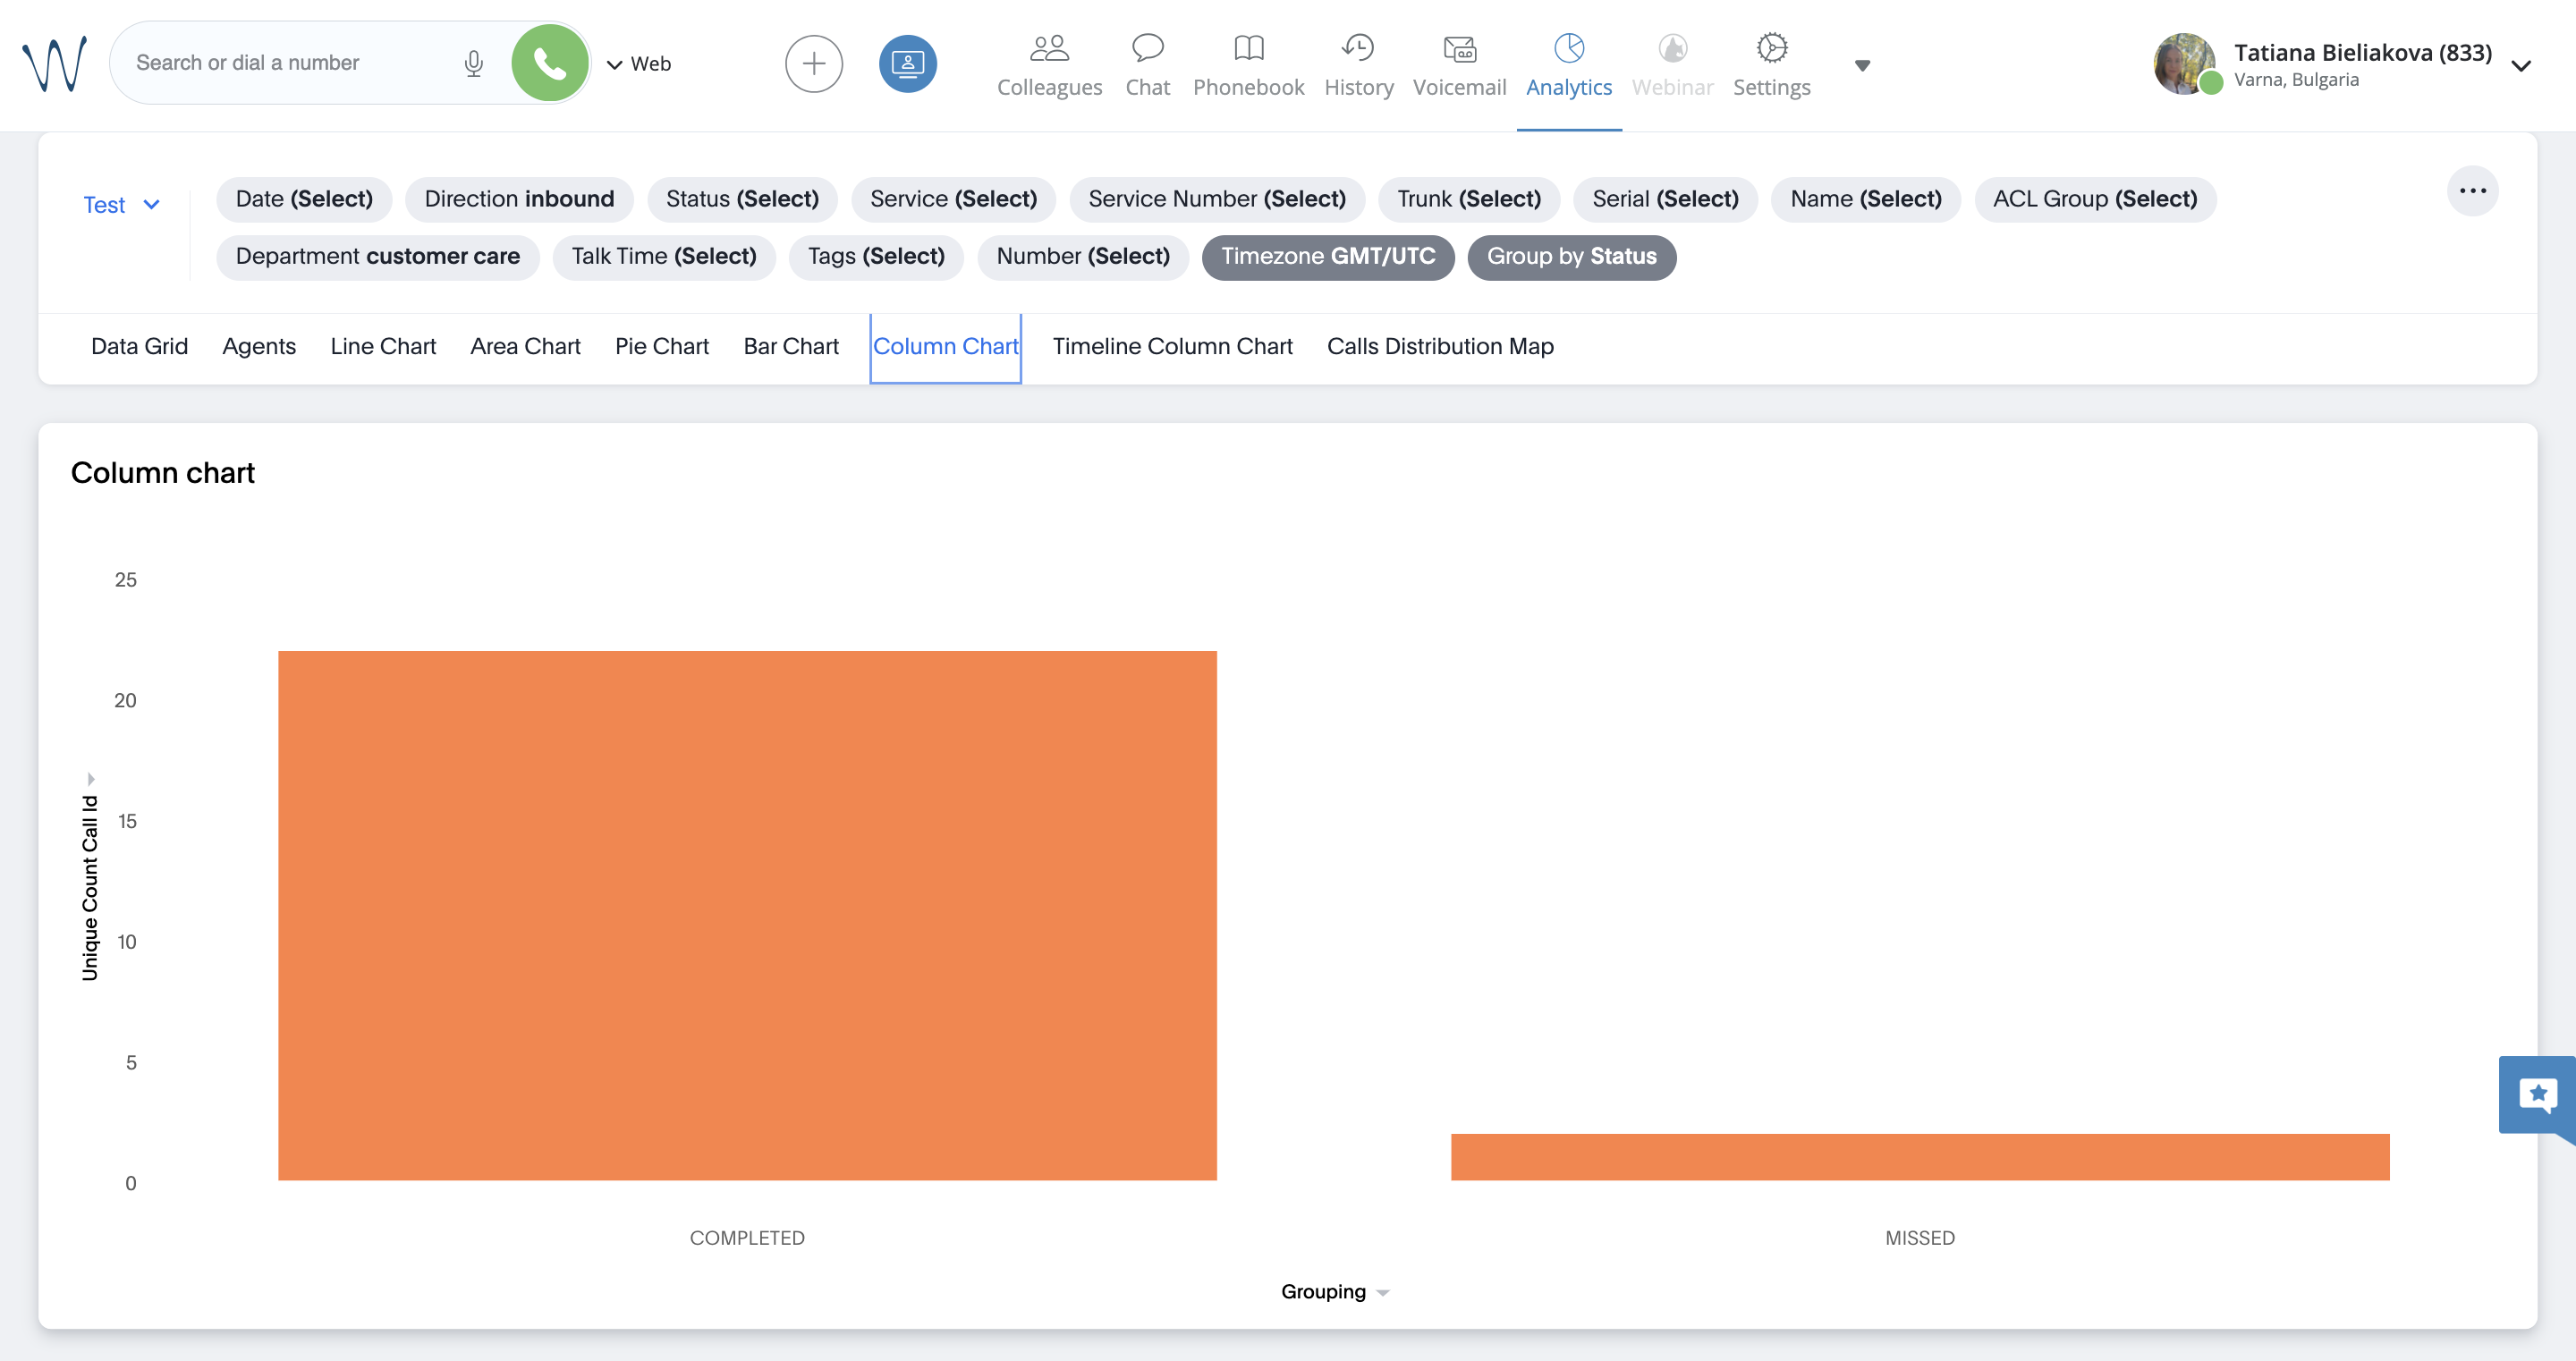
View Different Charts
Collaboration Analytics provides the report data in different charts and you can easily navigate between them by choosing the necessary tab:
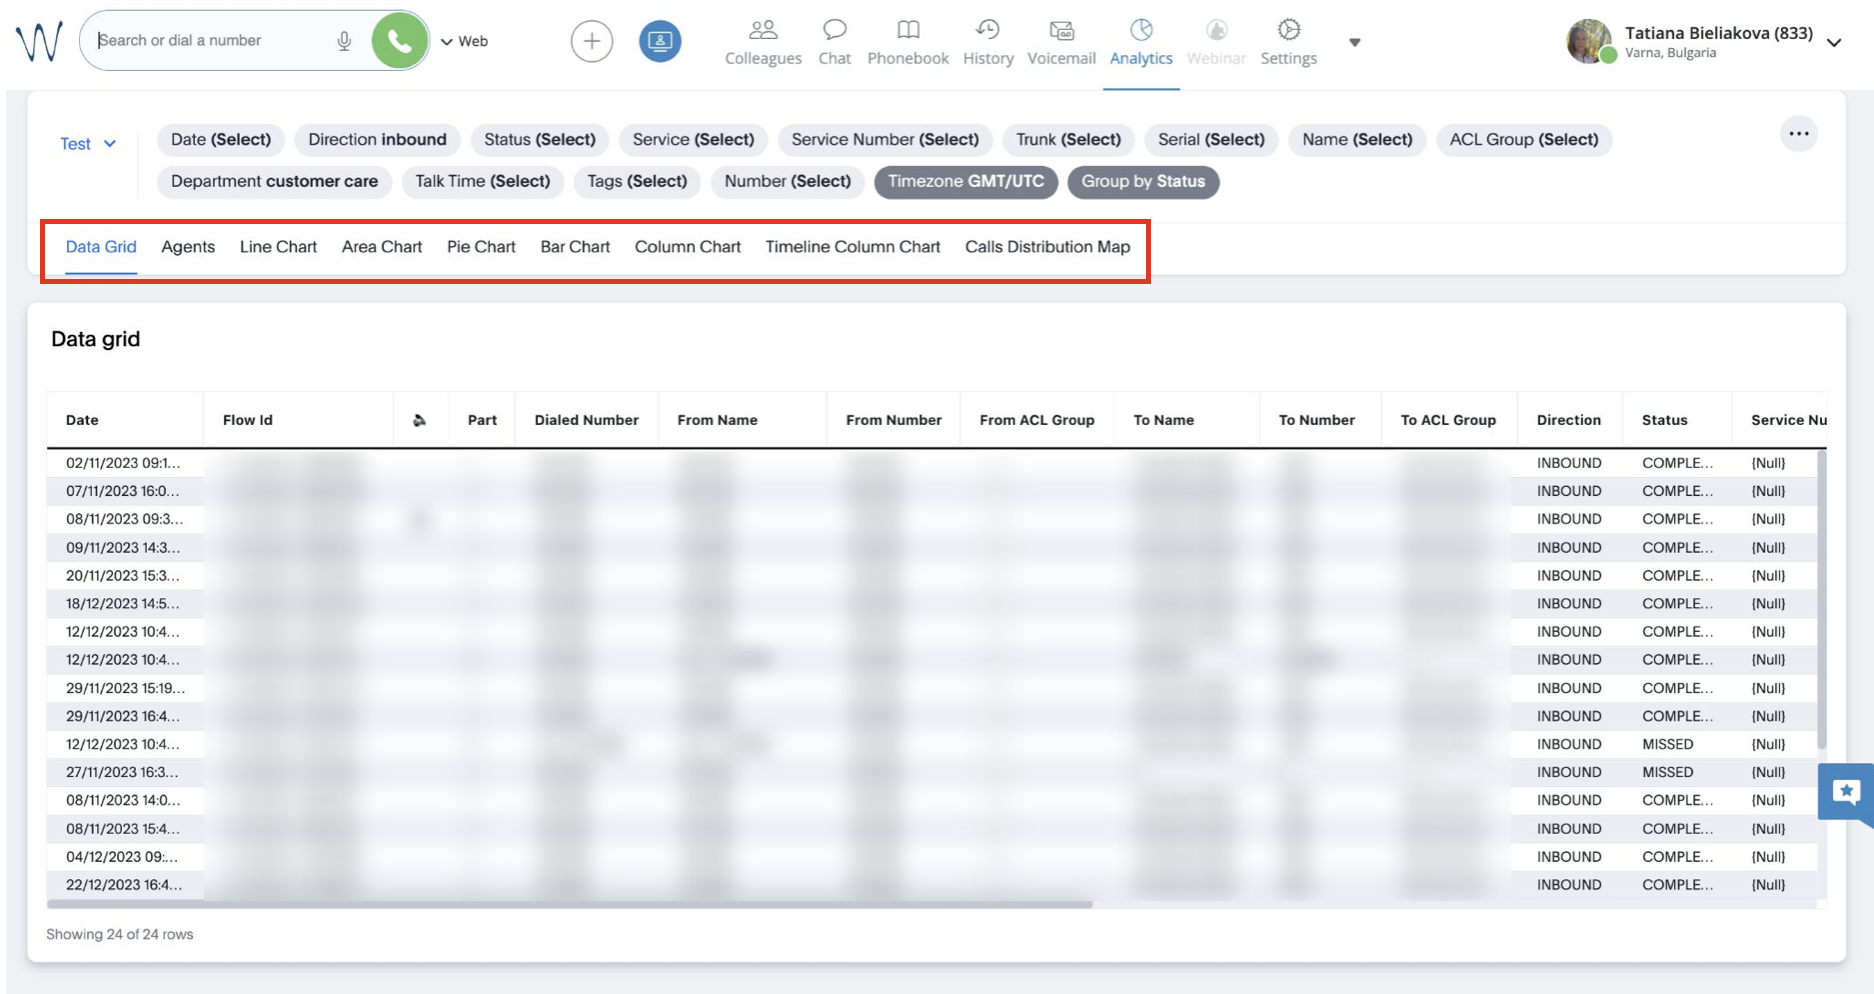
The following views are available:
- Data Grid
- Line Chart
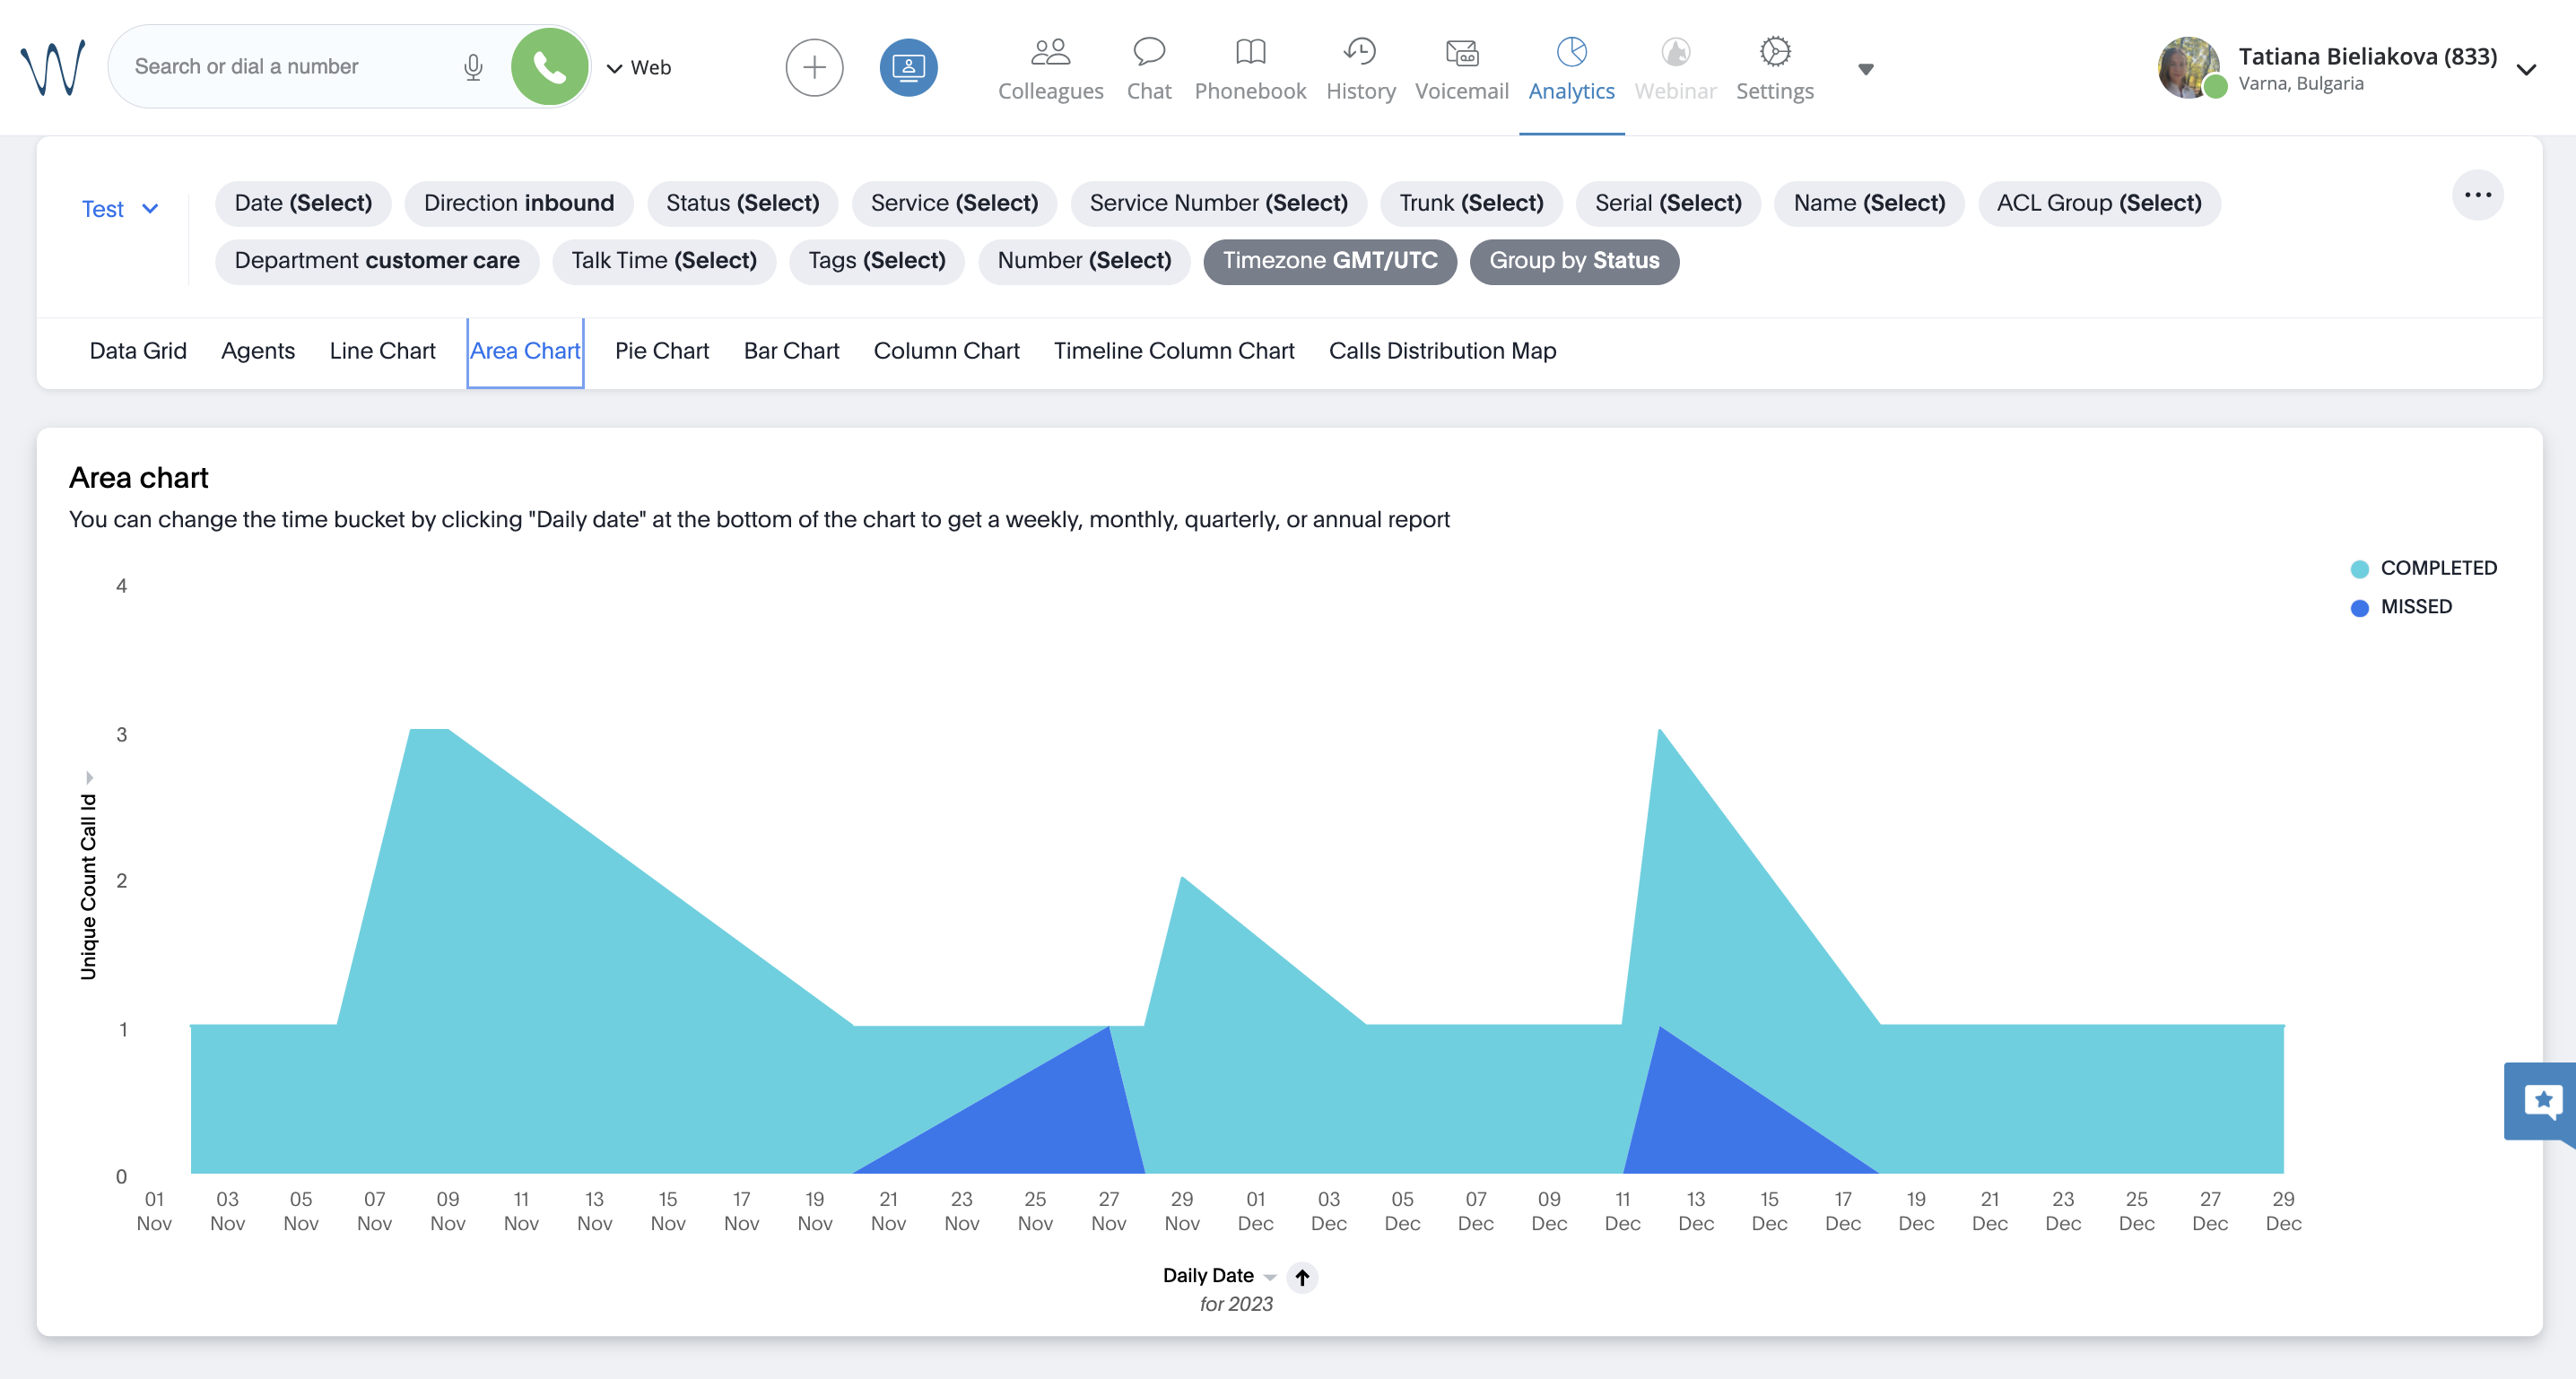
- Area Chart
- Bar Chart
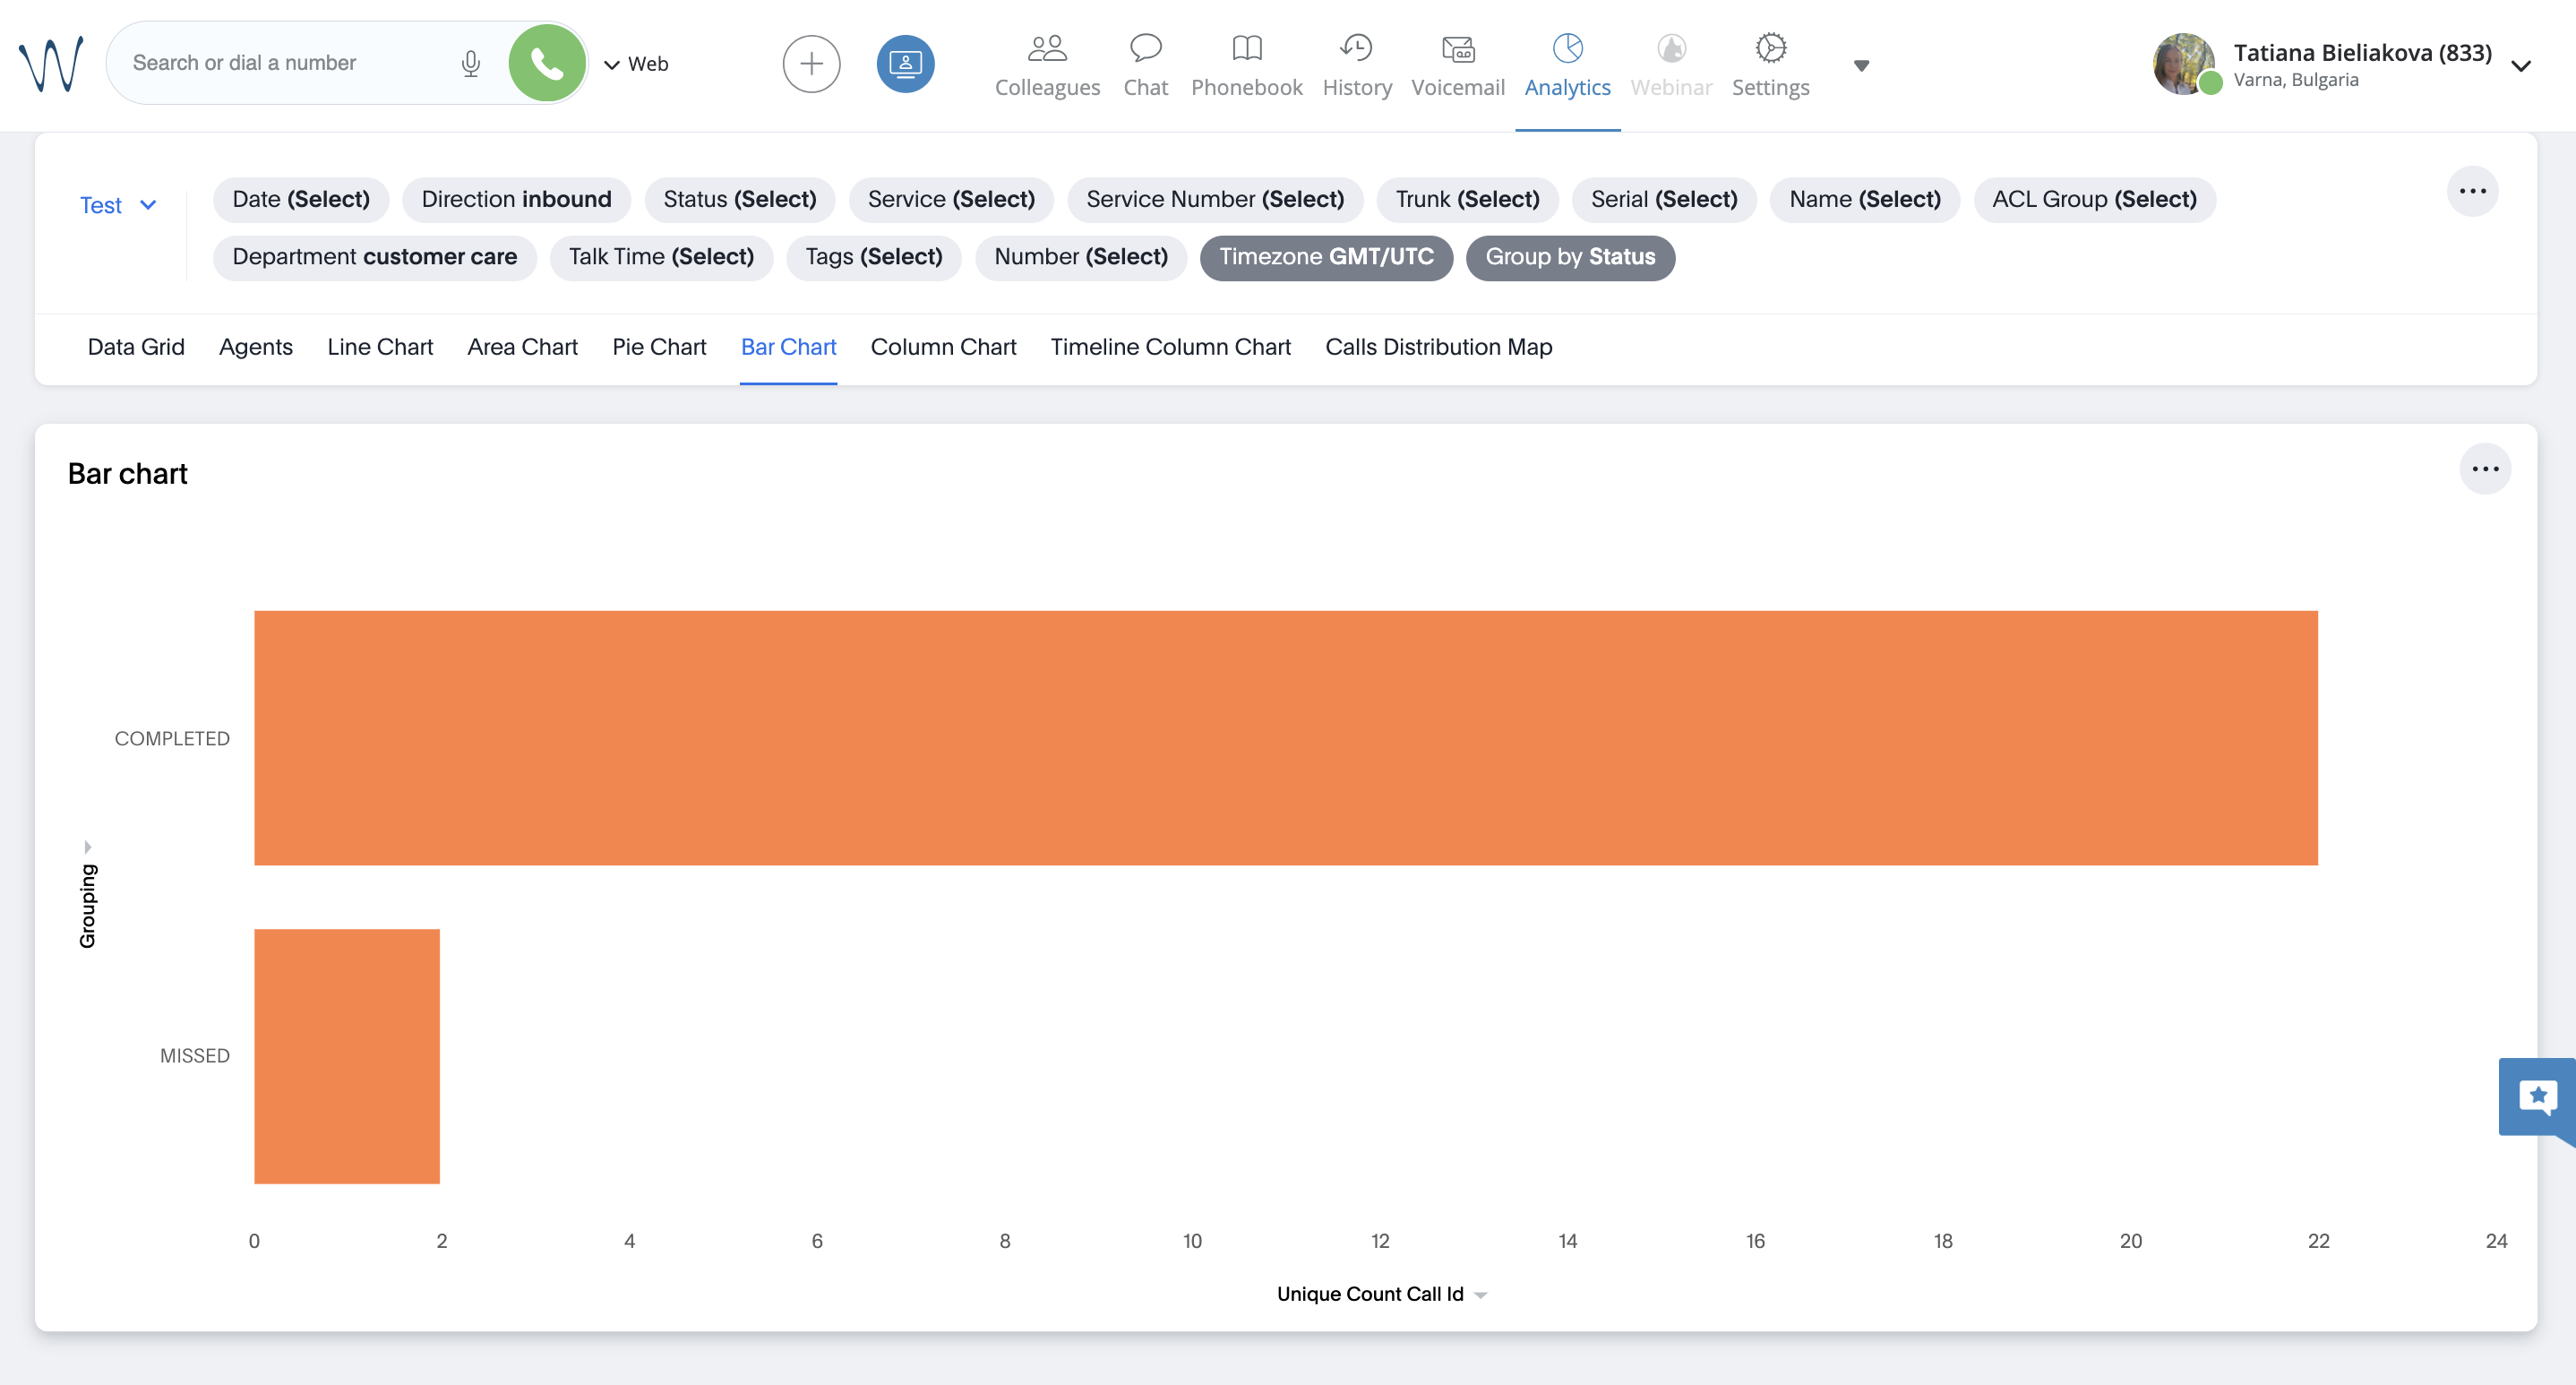
- Column Chart
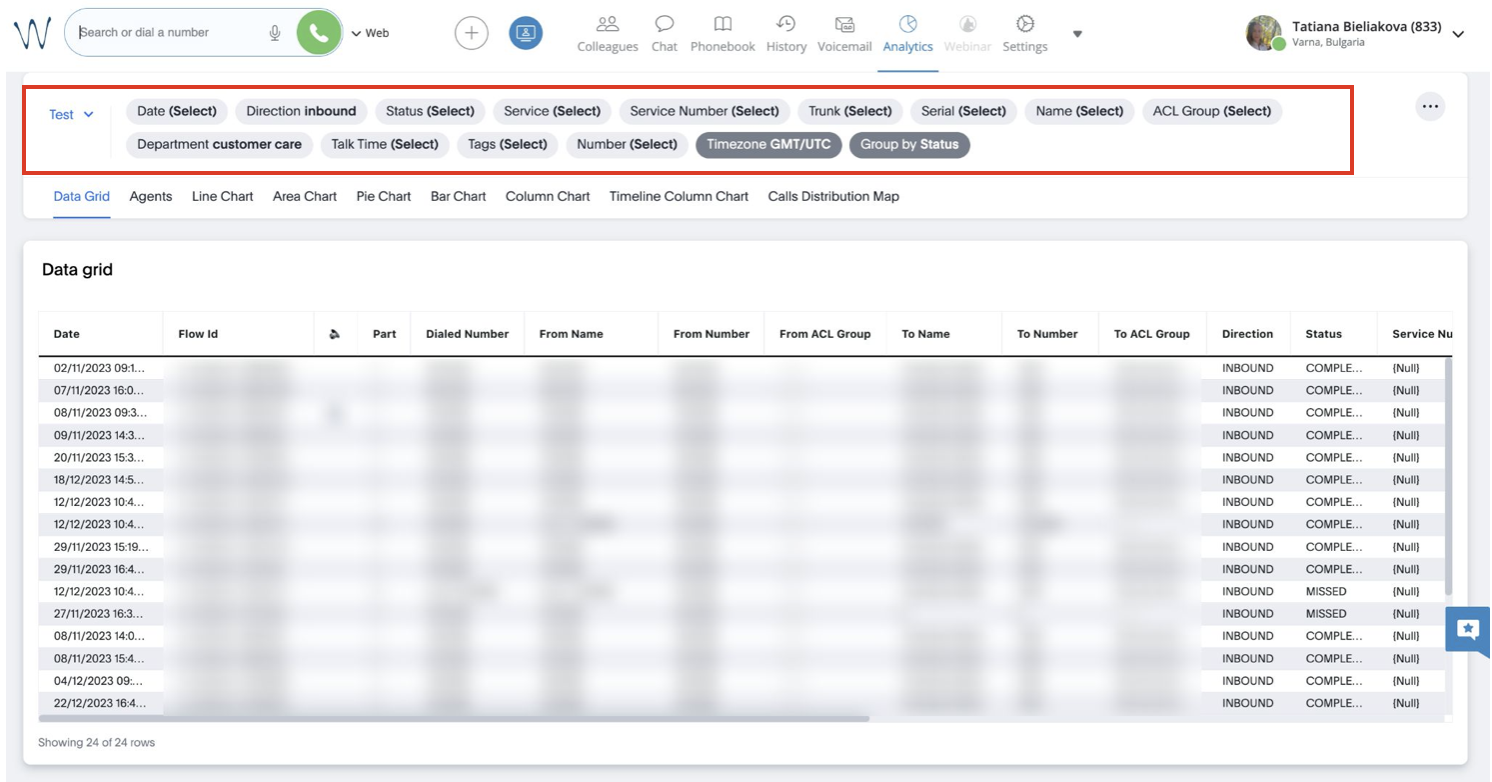
Filter Report Data
On the page that opens, you can see a report that displays data according to the filters at the top:
When you click on a filter, a pop-up window appears, which allows you to choose by which parameters you want to filter the report. E.g. clicking on the filter Direction (1), you can select inbound/ internal/ outbound calls (2):
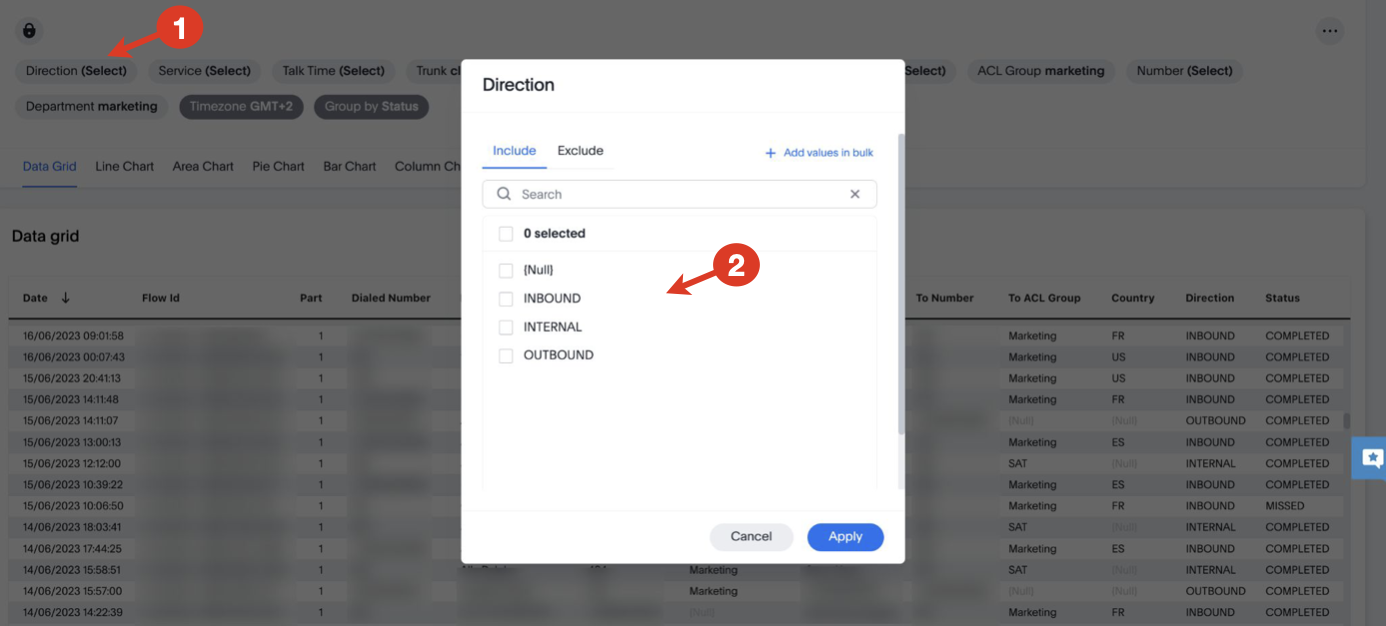
Note: Currently, the selected filters are cleared after the page is reloaded. Saving filters after page reload is planned in Q4 2023
The filters include:
- Direction: choose if you want to see inbound, internal, or outbound calls
- Service: select the services (Call groups) you want to be displayed
- Talk Time: select talk time (currently, the filter is available in seconds)
- Trunk: choose the trunks to be included in the report
- Tags: select available tags
- PBX: choose the necessary PBX serial(s)
- Date: choose the period by which the data should be filtered:
- On (=): lets you indicate a specific date
- On or after: displays data of a chosen date and later period
- Before: displays data of a period before the selected date
- Between: allows to indicate a specific interval, with start and end date

- Name: select the user(s) to be included in the report
- ACL Group: select ACL group(s) to be displayed
- Number: choose the number/ extension to filter all incoming and outgoing calls to the selected number/ extension
- Department: select the necessary department(s) of PBX users
- Timezone: choose the timezone
- Group by: choose if you want to group the data by Status, Direction, Service, Trunk, or PBX.
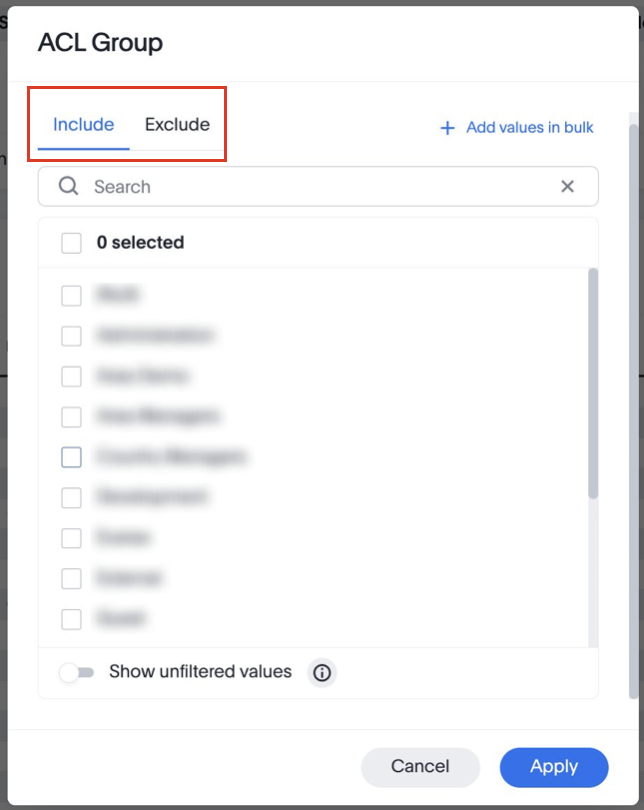
For most filters, you can choose either to include or exclude data:
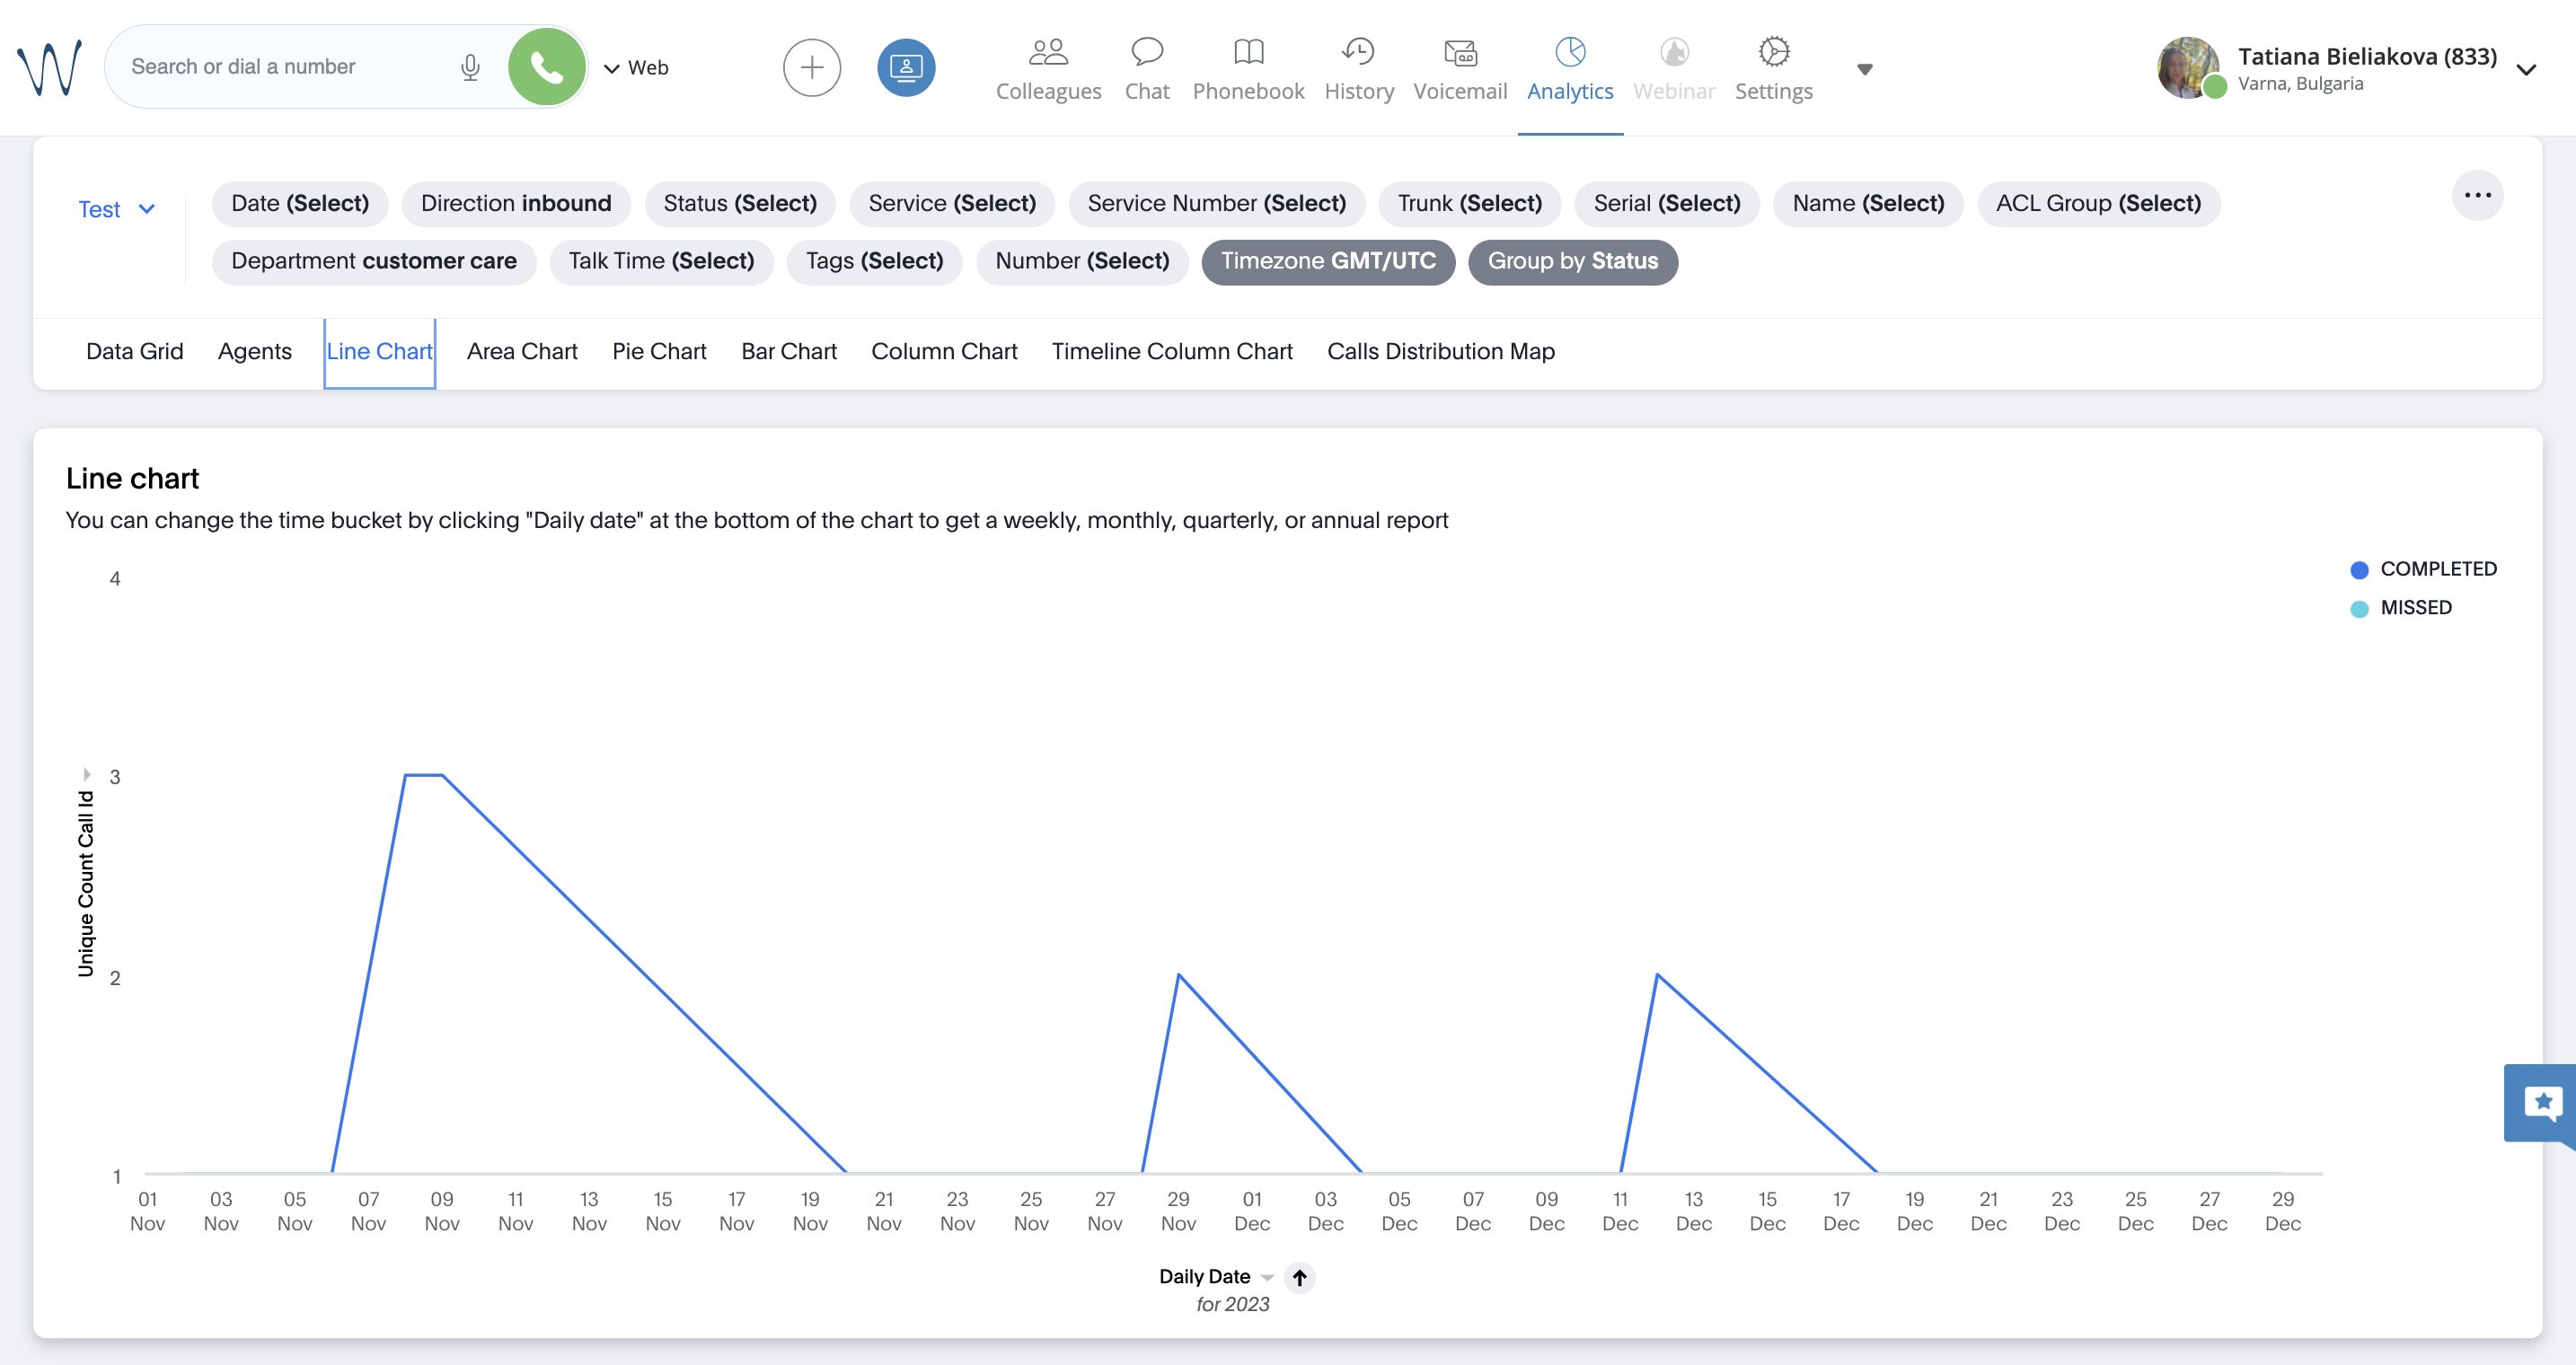
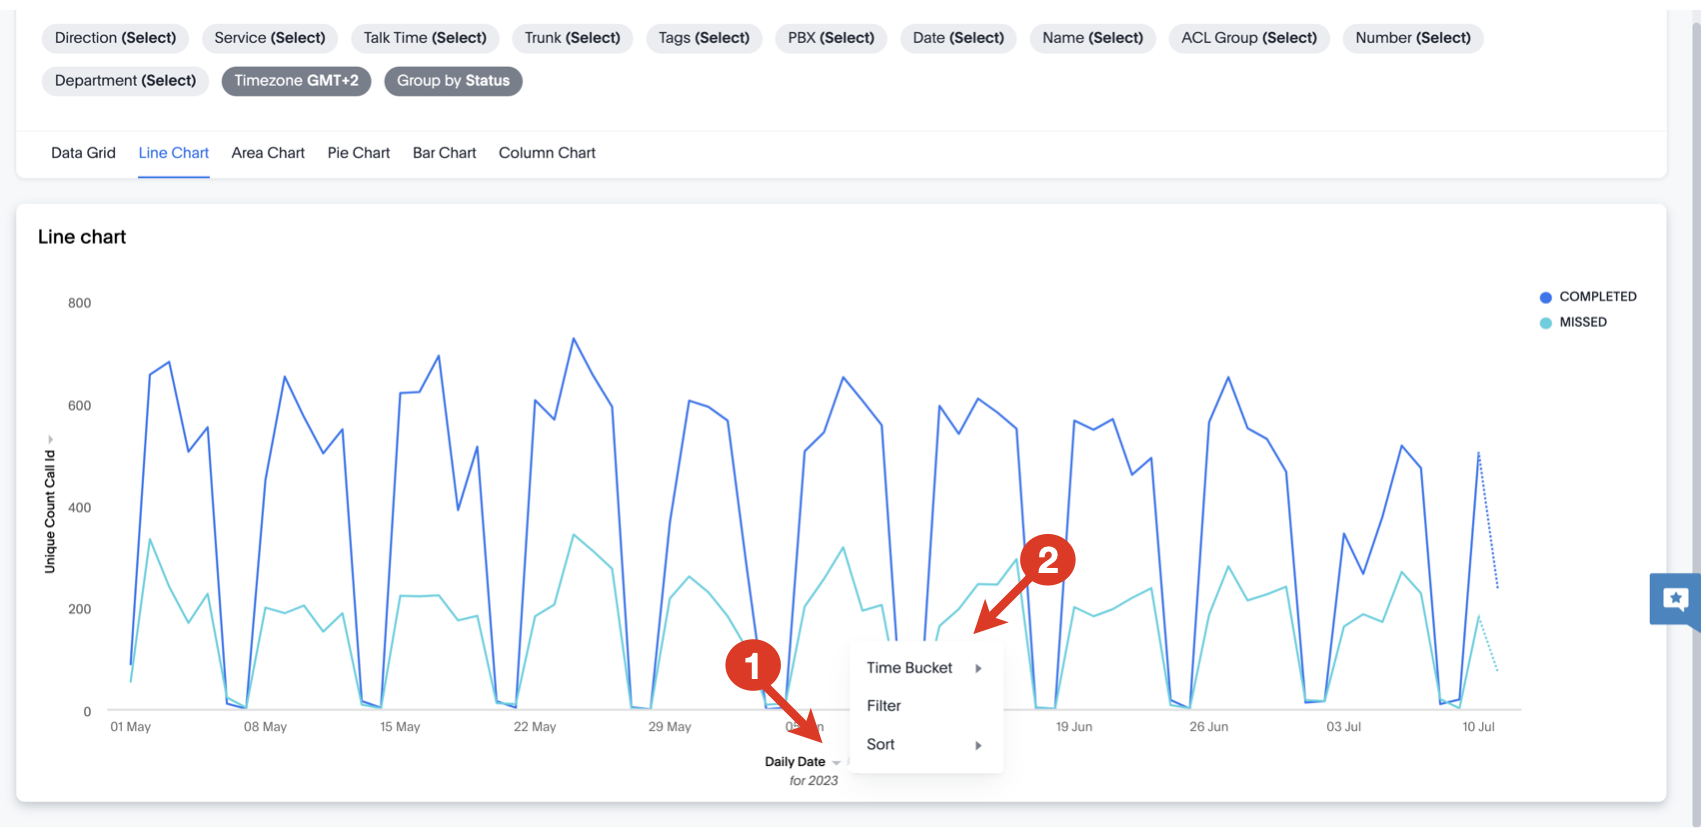
Choose time bucket / filters / sorting via the charts
You can also choose time bucket, apply filters or apply preferable sorting directly on the charts. For this, click on the top bottom button (1) ( in our example on the screenshot below it is "Daily Date"), and select the option you need (2):
Schedule Reports
Create scheduled report
Collaboration Analytics allows to configure scheduled reports to have them sent to email(s) at specified interval.
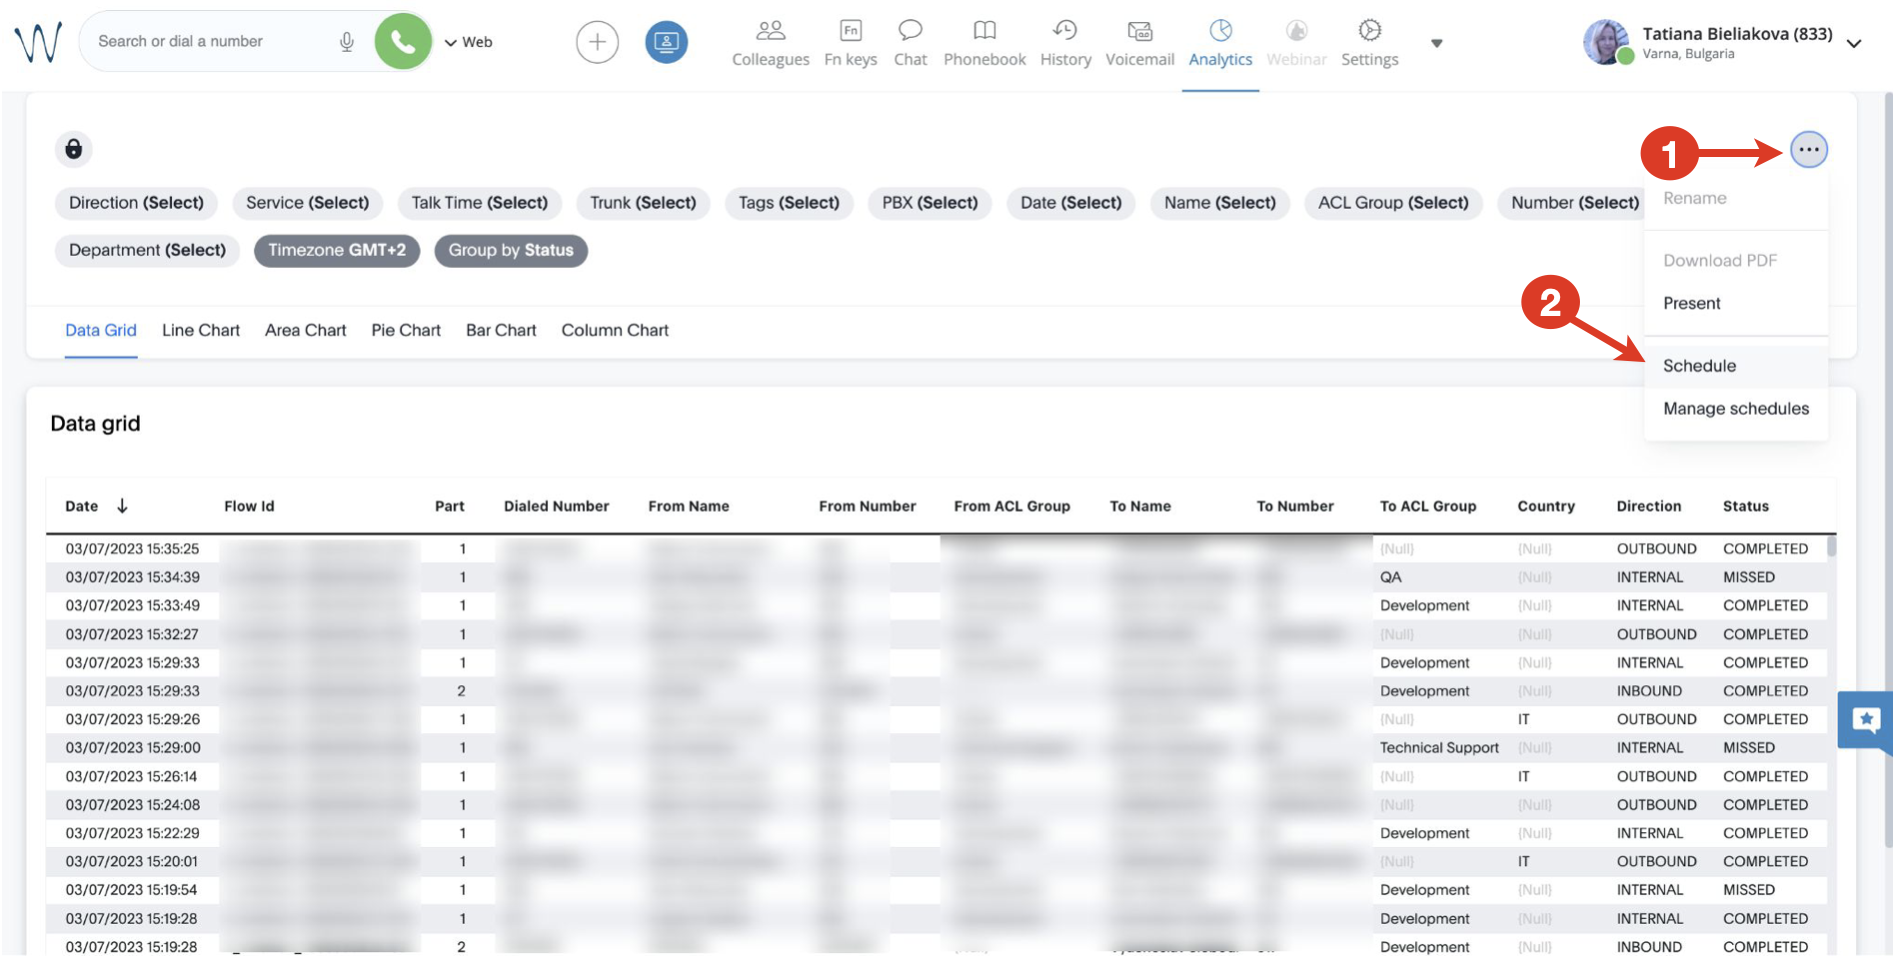
To schedule a report, click on the More (three dots) button (1) -> choose Schedule option (2):
On the Create Schedule screen that opens, fill out the following fields:
- Name: enter title for your scheduled report
- Description (optional): provide description if required; the description is included in the body of the email
- Frequency:
- choose the preferred option: Every N minutes / Hourly / Daily / Weekly / Monthly
- select at which time the report should be sent
- choose day for sending the scheduled report
Type: choose if you want to receive the report in PDF or CSV

Note:
- CSV files are sent only for the visualisations that have tables.
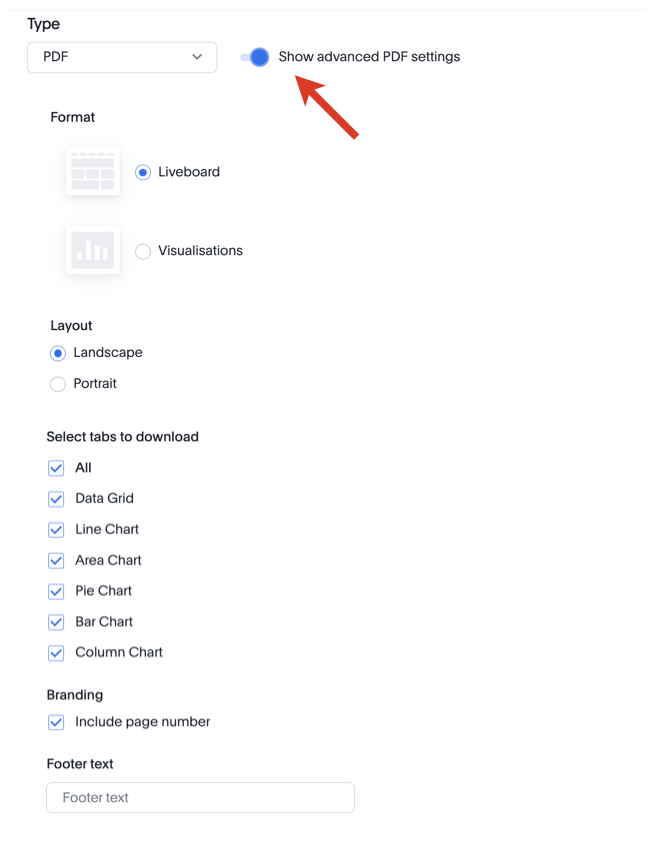
- For PDF, you can turn the toggle on next to Show advanced PDF settings and configure the following options:
- Format: Liveboard or Visualisations
- Layout: Landscape or Portrait
- Select tabs to download: choose if you want to receive all or specific charts only
- Branding: decide if page number should be included
- Footer text: enter text for the footer of the report
- Recipients: you are automatically added as recipient of the report
Click Save to save the scheduled report:
Manage scheduled reports
To manage your scheduled reports, click the More (three dots) button (1) and select Manage schedules (2):
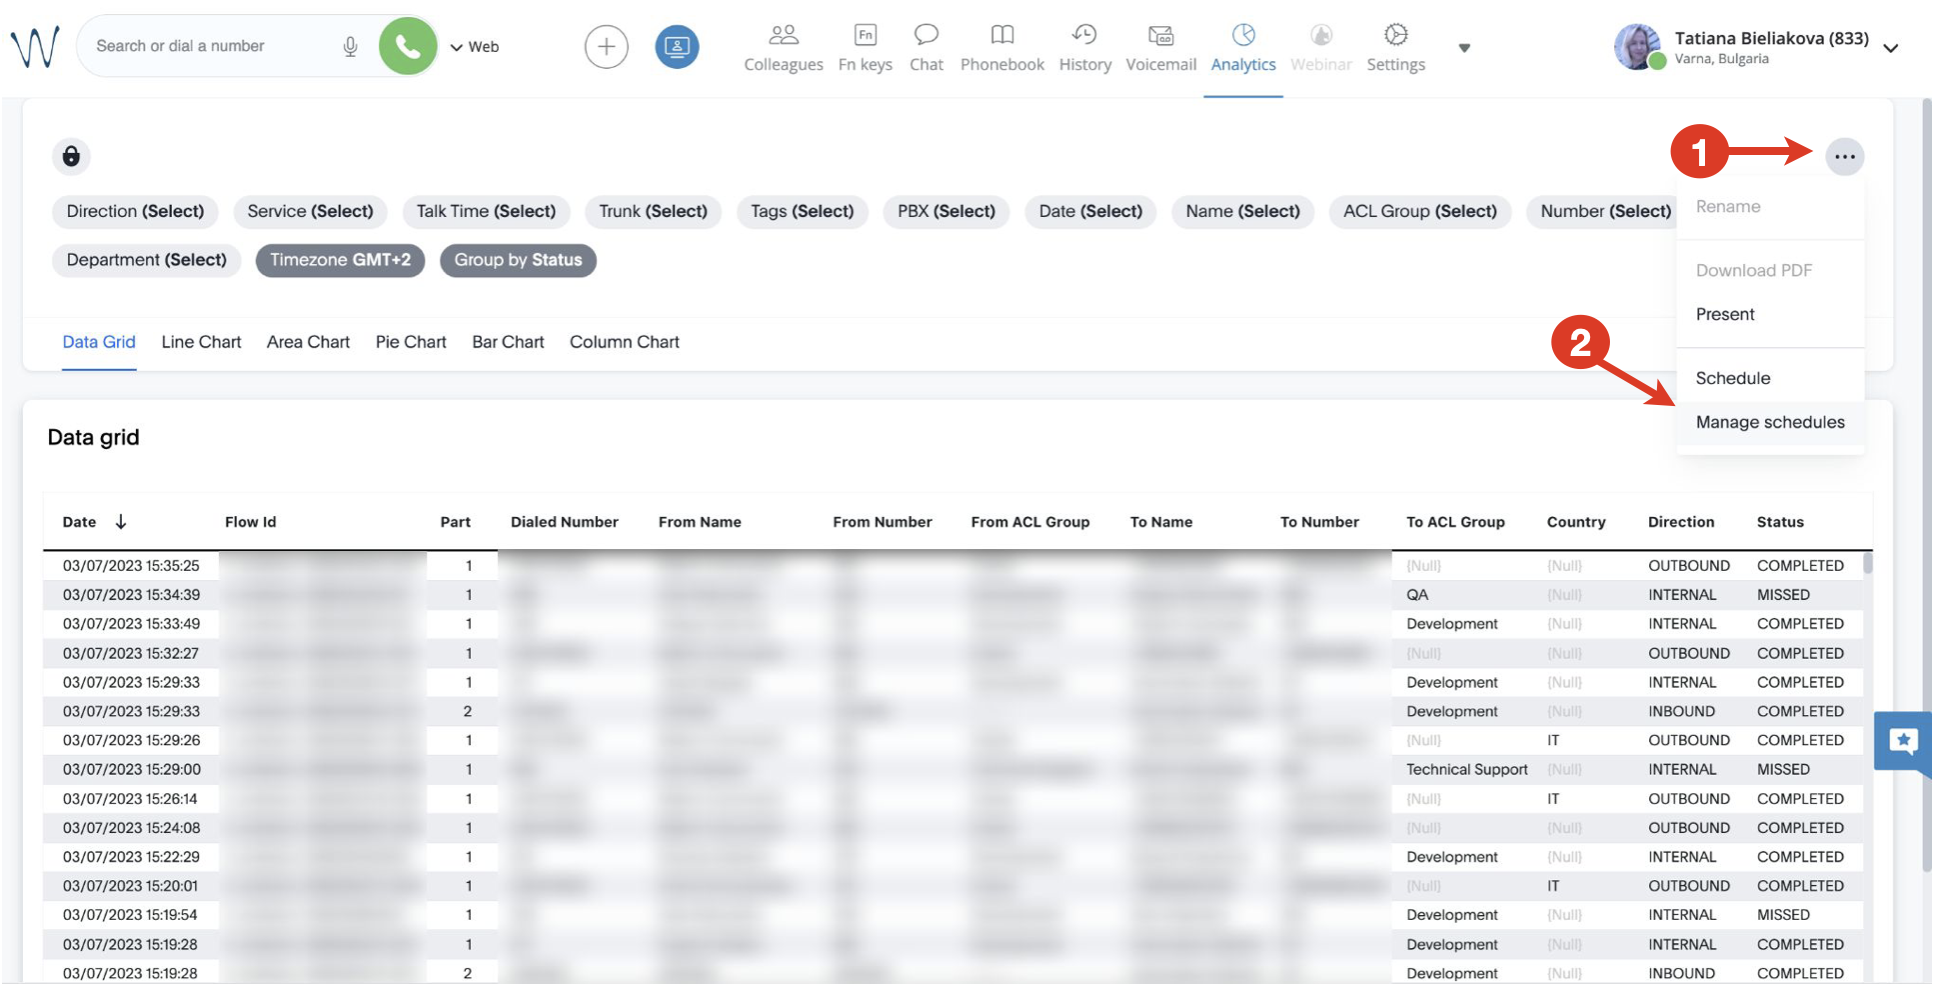
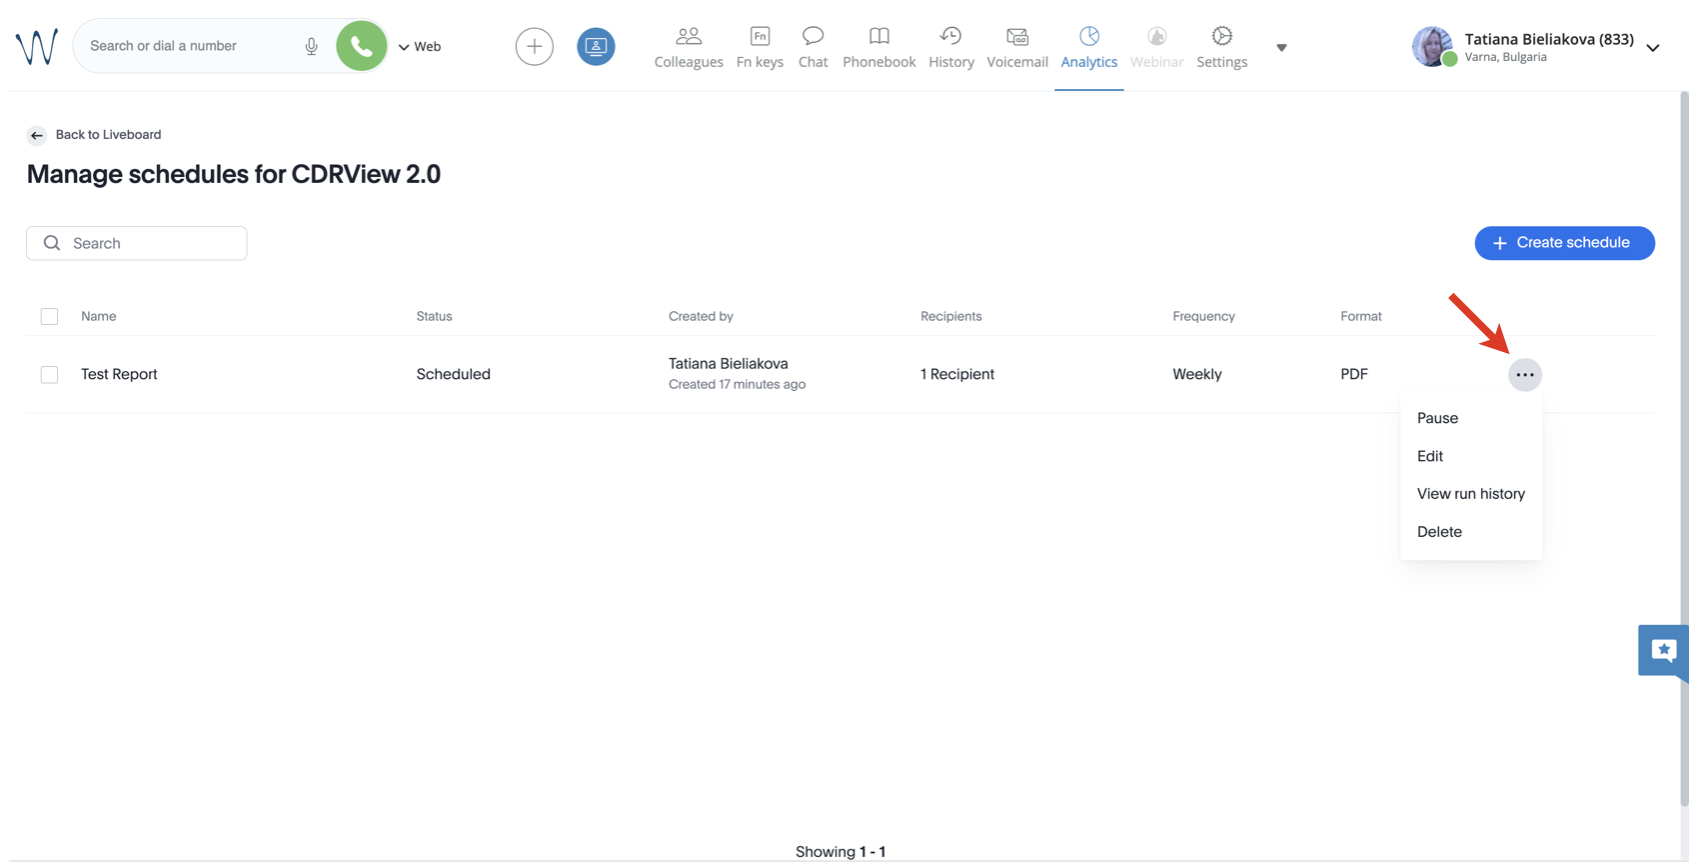
Click More (three dots) next to the necessary report, where you get the following options:
- Pause
- Edit
- View run history
- Delete
In case of pausing a scheduled report, its status changes to Paused:
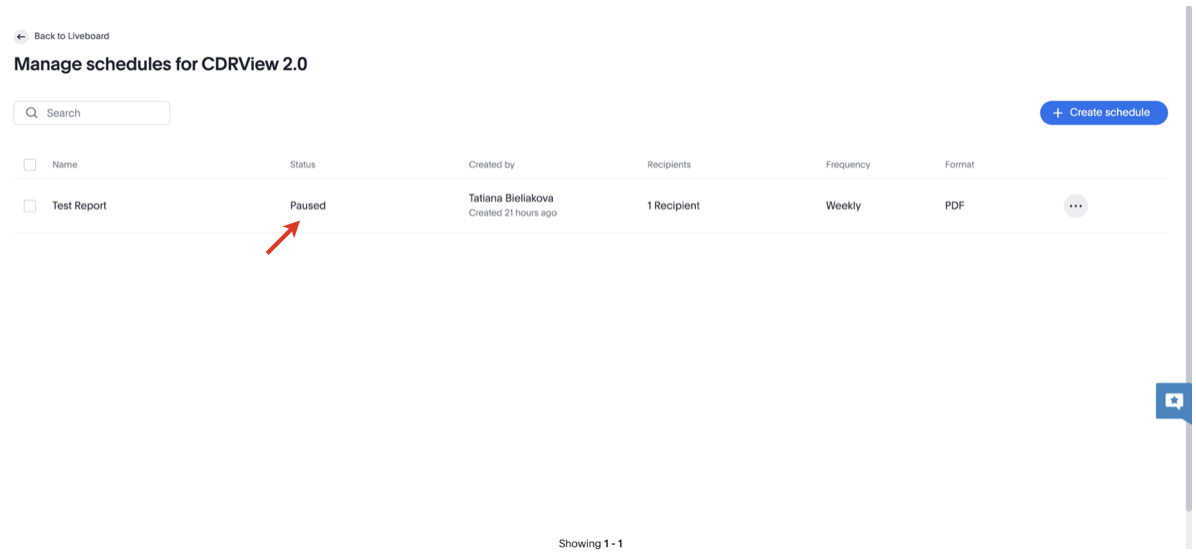 You can resume the scheduled report any time.